The brightest star in the commodities firmament? That changes from day to day in response to shifts in supply and demand. But copper, or ‘red gold’ as it is sometimes referred to, is nearly always a candidate for this garland.
This has certainly been true over the past 10 months as hopes for a post-lockdown rebound by China’s economy, growing awareness of the amounts of copper needed to build clean energy infrastructure and the political clouds over a number of major producers – Russia, Chile, Peru – have kept the metal in the spotlight.
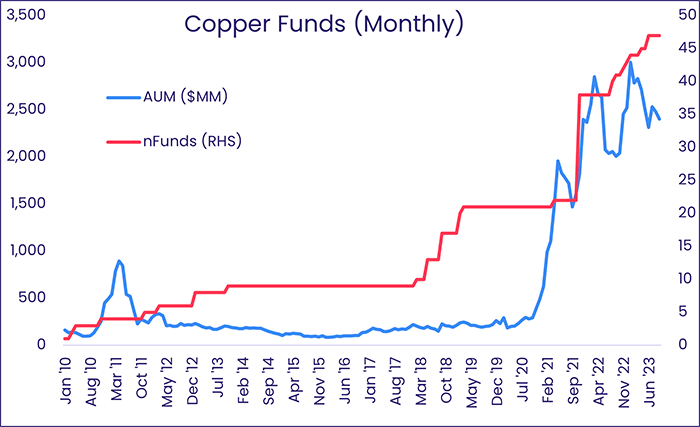
Copper’s footprint has also been growing in the mutual fund and ETF spaces. As the chart below illustrates, EPFR now covers almost 50 dedicated Copper Funds managing over US$2 billion in assets.
All of which raises the question, can this broad interest and growing coverage be translated by quantitative means into additional alpha?
Copper plating the coverage
EPFR tracks mutual funds and ETFs by mandate, tagging them and bucketing them according to the dominant asset classes in their portfolios or the themes they invest in. Some fund groups have historical coverage stretching back to 4Q95.
In the case of dedicated Copper Funds, EPFR has been tracking them as part of the broader Commodities/Materials Sector Fund group since 4Q09. We have now broken them out into a separate fund group so that our clients can track their flows, assets and returns separately from those of other funds.
As a simple test of the quantitative value of this custom group, we decided to add it to the mix we use for an existing commodity strategy that was featured in a previous Quants Corner, “Getting the right balance on commodities exposure” published in 2020. This strategy relies on aggregated 20-day fund flows to pick between gold, silver, energy and agriculture.
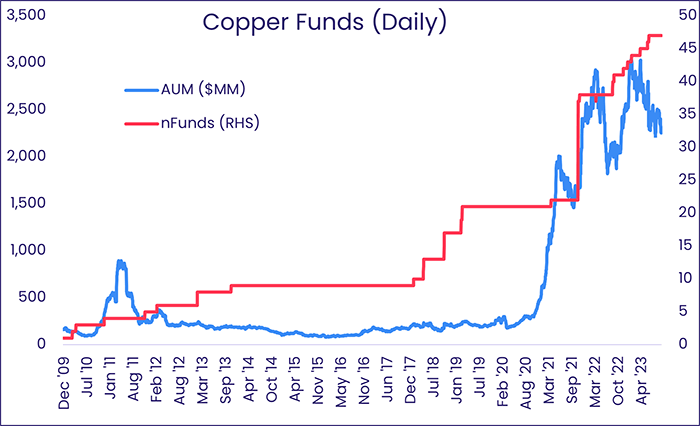
To add copper to this strategy, we need good daily coverage of copper funds. As you can see from the chart below, there is no coverage drop-off when switching from monthly to daily data. Importantly, for back-testing purposes, coverage is good over time as well; at least 10 copper funds are reporting daily flows all the way back in 2013.
In the running for a bronze medal
To answer our question about the quantitative value of our Copper Fund coverage, we back-tested both the standard four-input commodity strategy and a revised strategy adding copper to the original four commodities.
Each week, the commodities are divided into five buckets based on the latest-available twenty-day flow percentage into the relevant fund group. Of course, with the standard commodity strategy, there are only four commodities so bucket 3 is empty. To realize the value of the strategy requires going long the top-ranked commodity and short the bottom-ranked commodity.
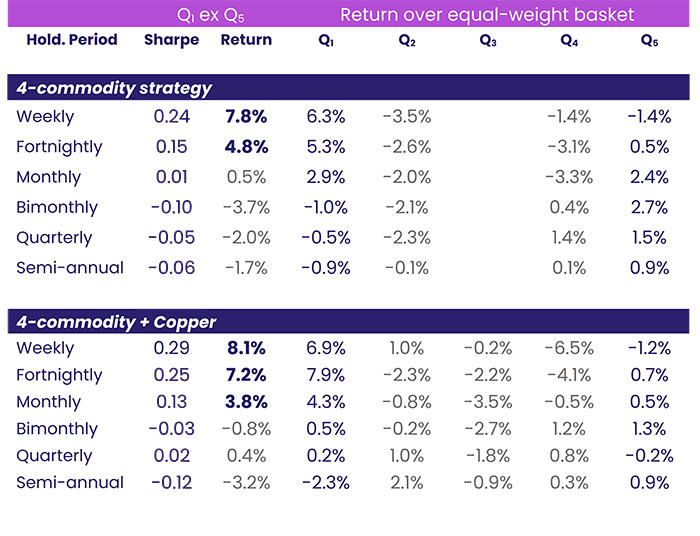
As you can see from the table above, which shows annualized returns to each quintile in excess of that to the equal-weight basket of commodities, the addition of copper results in a slight improvement; the commodity with the highest flow beats the one with the lowest by an annualized 8.1% rather than 7.8% over a weekly holding period.
There’s an even better improvement, 7.2% versus 4.8%, when using a two-week holding period. Thus, a strategy that goes long one commodity and short another would perform better with the addition of copper to the list of investable assets.
Our first pass suggests that copper is a useful – but not spectacular – addition to EPFR’s standard commodity strategy that improves the returns for all holding periods except semi-annual.
Did you find this useful? Get our EPFR Insights delivered to your inbox.


