In late February of 2022, Russian troops poured into Ukraine, initiating a conflict that continues to this day. As the Ukrainians fought back, a cycle of Western sanctions and cuts in Russia’s energy exports to Europe posed multiple questions for policymakers and financial markets.
Among those questions were – and are — the adaptability of European industry to rising natural gas prices, the willingness of countries to utilize controversial alternatives such as coal and nuclear power, the future supply equilibrium for global oil supplies, the degree to which governments are willing to intervene in domestic energy markets and the costs of the measures they do take.
With 10 months of EPFR’s flows and allocations data to draw on, this blog will examine the impact the conflict has had on global energy markets and the calls investors have made in response to some of these big questions.
No rush for the exits
To look at the big picture, we can run a simple flows versus returns comparison.
During the market crash triggered by the emergence of Covid-19 as a global pandemic, the S&P 500 index lost just over a third of its value in a month, bottoming on March 23, 2020. In order to get a cleaner signal for the issue we are addressing, we look at a time period — from the first quarter of 2020 to the present – that excludes that market shock. Furthermore, we consider only EPFR’s monthly data over the course of this analysis because of that dataset’s more comprehensive coverage.
EPFR not only classifies funds by type (equity, bond, balanced, money market and alternative) but also classifies funds by style or sector (Large Cap Growth, Energy Sector, etc.). The chart below shows monthly flows and returns to Energy Sector Funds from 2Q20 to the present. Flows are in dark blue, returns in light blue, and the dashed line marks February ’22, the month when Russian armor began to roll into Ukraine.
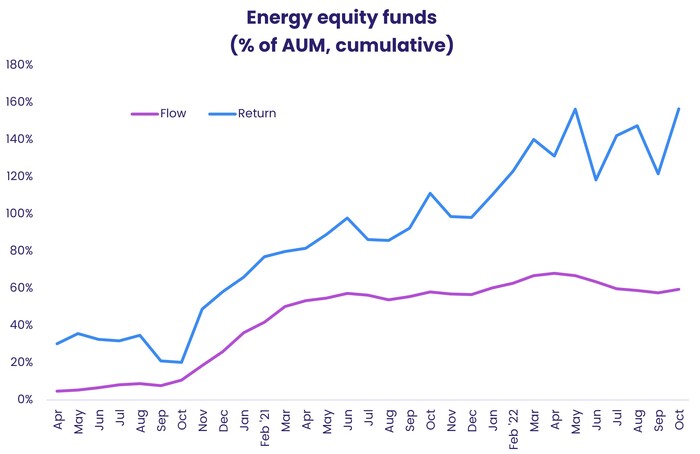
As seen in the chart, investors took Putin seriously and factored his threats into their expectations for future energy prices. Both flows and returns for those Energy Sector Funds began to rally in late 4Q21, almost two months before the invasion.
Thereafter, although returns have become more volatile, these funds have not given back their collective gains. Flows, on the other hand, have been far more muted; a slight inflow in early 2022 was subsequently reversed.
Through green-colored glasses
What about the assumption that offsetting reliance on Russian fossil fuel exports will accelerate the shift of market share to renewable and clean energy providers?
Again, we can use one of EPFR’s standard filters to get a broad sense of how investors responded to events in Ukraine. The filter in question classifies funds as socially responsible or not. Applying it, we create the chart below which shows cumulative percentage returns to energy funds aggregated up into ESG and non-ESG buckets.
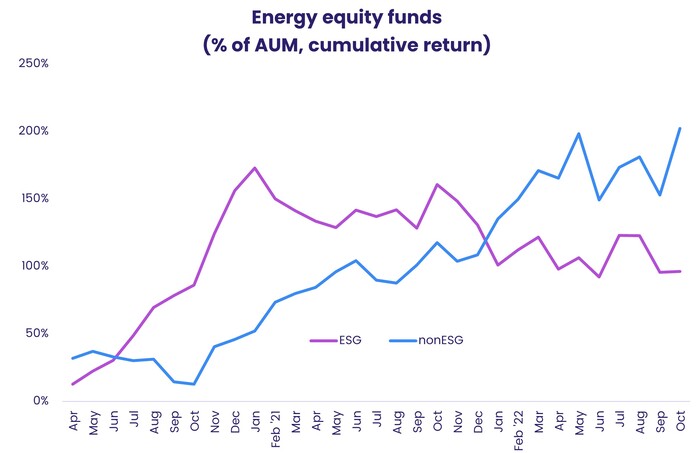
As the chart illustrates, returns have – so far — accrued to the dirtier kind of energy fund at the expense of their SRI/ESG counterparts. This is hardly surprising. Renewable energy capacity takes time to construct and bring online. Meanwhile, as a consequence of the invasion, Russian oil and gas supplies to Europe have to be offset immediately. This made investments in oil and gas that weren’t Russian more valuable.
A map of winners and losers
Given all the talk about winners (Saudi Arabia, the US) and losers (Developed Europe, India, Korea) from the oil and natural gas supply shock delivered by Russia’s invasion, how did energy funds do regionally?
To address that question, we looked at asset-weighted returns for the various geographic mandates tracked by EPFR within the Energy Sector Fund universe. These are fund categories based on where funds invest, geographically. Many are country related, such as Germany or Singapore Energy Sector Funds. Others are regionally focused — Latin America, EMEA or Asia ex-Japan – and some have a global focus. The latter include Global Emerging Market (GEM) and Global ex-US Energy Sector Funds.
As a result of this clearly defined categorization, it is easy to asset-weight the monthly returns of relevant energy equity funds to isolate the return to each geographic focus. Twelve of these groupings had non-zero returns for each of the 31 months between April 2020 and October 2022.
Each of these twelve geo-foci can be represented as a point in a 31-dimensional space, one for each month of returns. We can choose a set of axes for this space so that the first axis captures the most variation, the second — orthogonal to the first — captures the next most, the third, orthogonal to the first and second, captures the third-most, and so on.
For purposes of visualization, we collapse this 31-dimensional space into the top two axes, or principal components, capturing the bulk of the variation, as seen below.
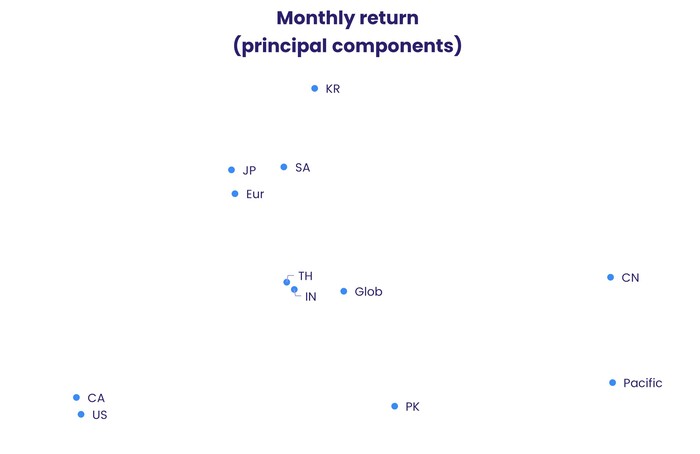
As you can see from the chart, returns differed widely. Each of the regions had a nuanced, different, reaction to recent market events.
Doing the same thing with flows, we see that investors in equity Energy Sector Funds were not so nuanced.
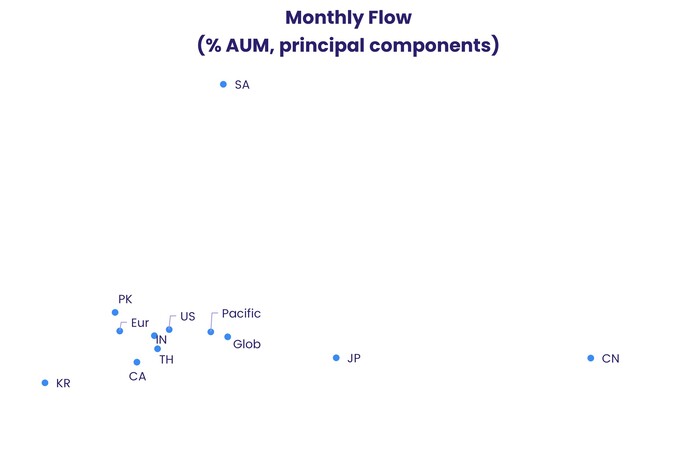
As you can see from the chart above, energy investors largely treated all regions the same, with only dedicated Korean, Japanese, Chinese and Saudi Arabia Energy Sector Funds being singled out for different treatment.
Returns appear suspect
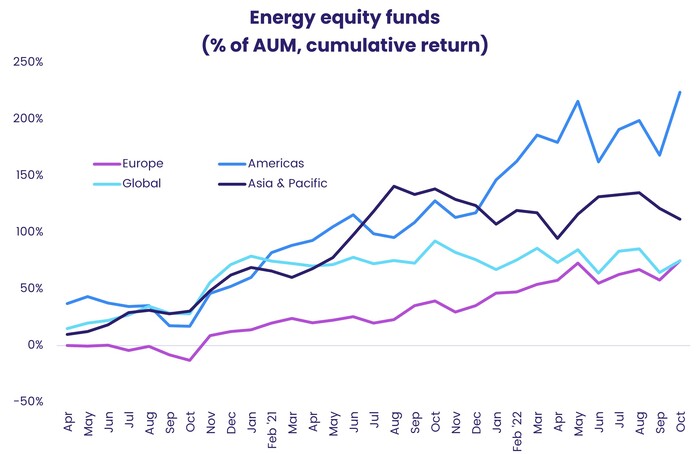
This broad-brush approach is also apparent when we look at broader groupings. Each of the geographic foci was aggregated up into one of four regions: the Americas, Europe, Global or Asia Pacific.
When we plot weighted-average cumulative returns, we see that most of the return accrued to energy-sector funds in the Americas (mostly U.S. and Canadian funds).
On the other hand, most of the flow went to energy funds outside the Americas.
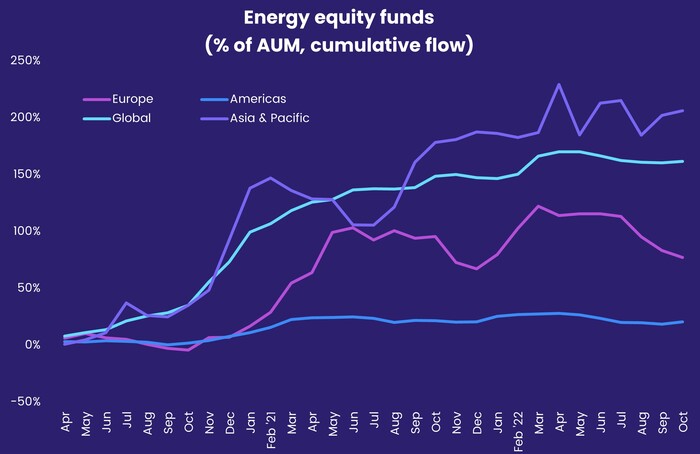
Are investors misallocating assets? Or have they accurately predicted an energy market where future value, and returns, lie outside the US and Canada?
These, and other questions we did not get to this time, will be addressed in future blogs.
EPFR’s Quants Corner offers regular insight authored by our resident quant team on Mutual Funds and ETFs allocations and flows from around the world.
Did you find this useful? Get our EPFR Insights delivered to your inbox.


