Evergrande, ranked among the Fortune Global 500, is the second-largest real-estate property developer in China with over 100,000 employees and annual revenues exceeding $70 billion. It also has an estimated $300 billion in debt outstanding together with a back-log, numbering in the tens of thousands, of promised-but-unfinished apartments. After Chinese regulators implemented requirements linking allowed debt levels to cash flow and capital reserves, it is struggling to service its debt.
This article follows Evergrande’s troubles through the lens of EPFR’s Bond Fund Flows, an offering that combines flows into ETFs and Mutual Funds together with their holdings of individual bonds. We show that applying the well-known fund-count indicator of Chen, Hong and Stein (2002) would have alerted investors, in advance, to the deterioration in the bond prices of this battling company.
Bond Flows
EPFR tracks individual bond-level holdings of ETFs and Mutual Funds, with historical data dating back to 2018. At the end of October 2021, the total assets under management of the 1,670 funds reporting bond-level holdings was $2,947 billion. The data has a monthly frequency, known with a lag of just over one month.
Chart 1 shows the number of funds reporting bond-level holdings, together with their assets under management, at the end of October of each year throughout the full history of the database.
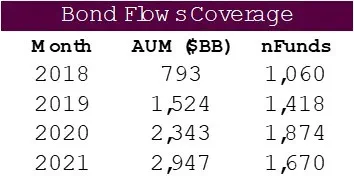
EPFR’s Bond Fund Flows data clearly indicates that coverage has ramped up steadily over time, to the extent that useful quantitative conclusions can be drawn from this data.
Returns
USD monthly mid-prices were downloaded for various Evergrande issues with maturities ranging between March ‘22 and June ‘25. Of these, per our database, the March ’22, June ’23 and June ’25 maturities were, by far, the most widely held.
Chart 2 shows USD mid-prices of these three maturities.
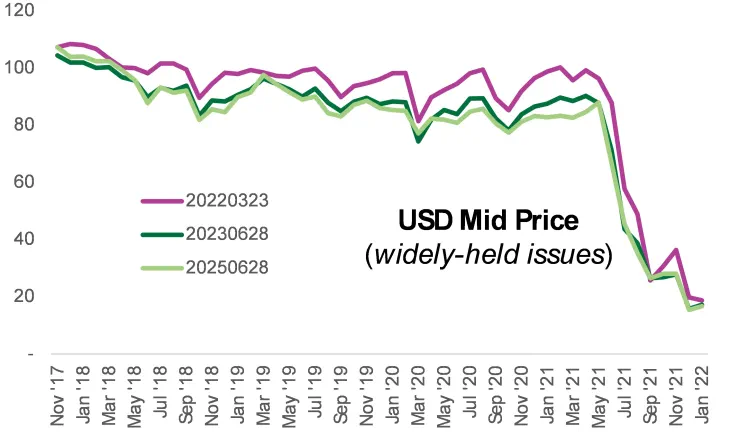
Chart 2 reveals that the prices of these three maturities track each other quite closely. Hence, throughout the rest of this article, an equal-weight average of the mid-prices of these three maturities will be used as proxy for Evergrande performance.
Fund Count
Chen, Hong and Stein (2002) showed how equities held by many funds tended to outperform those held by few. Following in their footsteps, the number of funds holding each of the three maturities was computed each month.
A two-month lag was implemented to reflect the delay in knowing the data, so that fund counts for October ’18 are shown as December ’18. Into the mix we throw in the equal-weight average of the USD mid-prices of the selected three maturities discussed in the section above.
Chart 3 highlights these four time series.
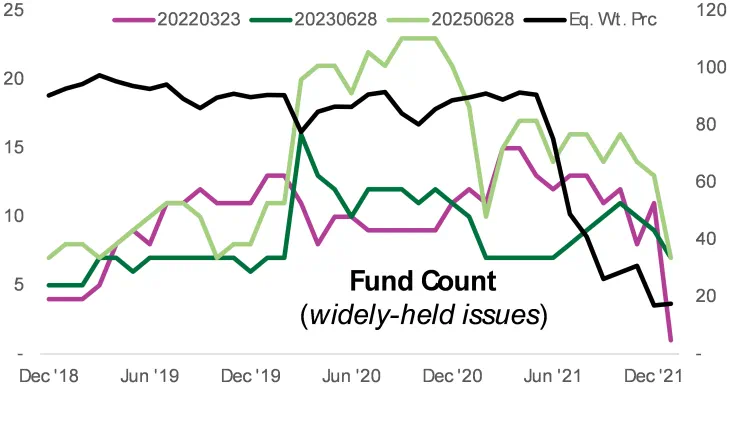
As seen in Chart 3, ownership in the three maturities peaked well before the collapse in the price of Evergrande bonds. The purple line indicates the March ’22 maturity, the dark green line is of the June ’23 maturity, and light green June ’25 maturity. First, the March ’23 maturity (purple) peaked in January ’20, which was known by March. The June ’25 maturity (light green) plateaued then fell after September ’20, which was known by November. Finally, ownership in the March ’22 maturity (dark green) fell after February ’21, known by April. All these events took place, and were known, despite the two-month lag, well before the collapse in price of Evergrande bonds after May ’21.
Conclusion
This is just one example of the usefulness of EPFR’s Bond Fund Flows data. Further research could involve a more systematic look at fund count across all the maturities tracked by EPFR. In addition, breaking down ownership by active or passive funds or by ETF or mutual funds is an avenue worthy of effort. Not only can other holdings-based factors be looked at, but fund flows could also be integrated with the positioning to better predict bond performance.
References
Chen, J., Hong, H., & Stein, J. C. (2002). Breadth of ownership and stock returns. Journal of financial Economics, 66(2-3), 171-205.
Did you find this useful? Get our EPFR Insights delivered to your inbox.


