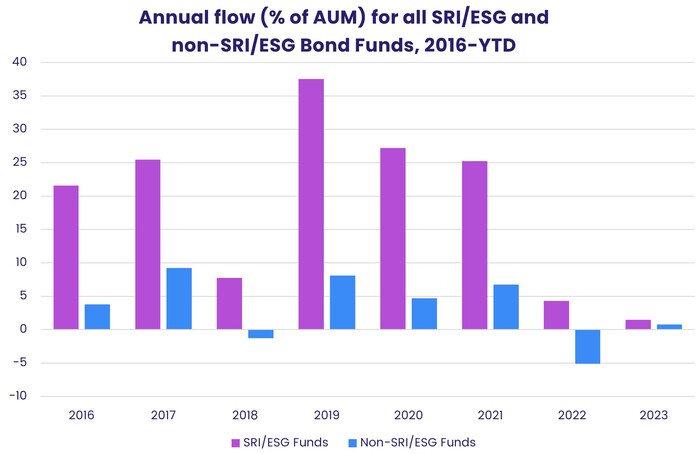
Between 1Q16 and 1Q23, the AUM of EPFR-tracked Bond Funds without socially responsible (SRI) or environmental, social and governance (ESG) mandates increased by two-thirds. Over the same period, the assets managed by SRI/ESG Bond Funds saw a 23-fold increase.
As an asset class, so-called “green bonds” have picked up significant tailwinds in recent years, ranging from generational shifts in perspective to the explosion of clean energy infrastructure projects. New indexes have emerged that track this market, major financial firms have been adding dedicated sustainable debt teams and the overall size of the market has grown to more than US $3 trillion.
In 2022, however, global issuance of sustainable debt fell year-on-year. Higher yields on US Treasuries, questions about the criteria used to designate bonds as green, social or sustainable, and questions about their effectiveness sapped investor appetite for this asset class.
This brings us to the issue this blog will address: What does the ESG tag on a Bond Fund mean?
Birds of a feather?
To answer the previous question, we start by tackling another question. Do ESG bond funds actually behave like each other and differently from non-ESG bond funds? To find out, we performed a principal-components decomposition on trailing twelve-month returns through December 2022.
EPFR’s data team classifies funds as SRI/ESG or not based on the prospectus and, when available, its SRI/ESG rating. EPFR’s monthly flows database also has fund returns. We can combine these data points to model the affinity of SRI/ESG Bond Funds to each other and to their non-SRI/ESG counterparts.
Each bond fund that reported data to EPFR for every month in 2022 can be represented as a point in a twelve-dimensional space, one for each month of returns. We can choose a set of axes for this space so that the first axis captures the most variation, the second – orthogonal to the first – captures the next most, the third, orthogonal to the first and second, captures the third-most, and so on. For purposes of visualization, we collapse this twelve-dimensional space into the top two axes, or principal components, capturing the bulk of the variation, as seen below.
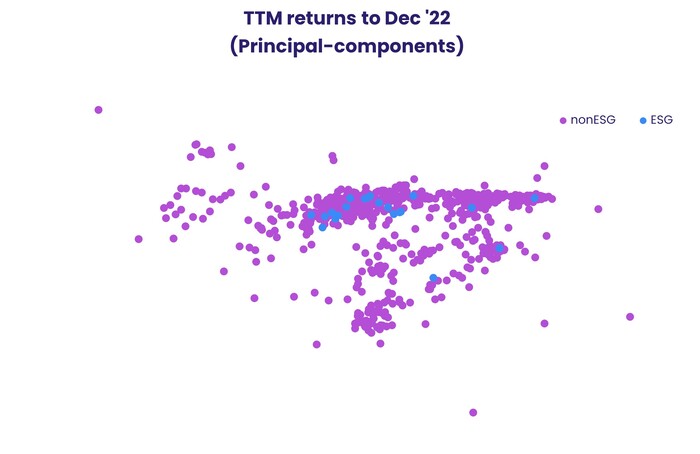
As seen in the above chart, SRI/ESG Bond funds — colored red — cluster together. This means that, from a returns standpoint, they behave similarly. Furthermore, a significant number of non-SRI/ESG lie outside of the core grouping for SRI/ESG Bond Funds.
In for the slightly bumpier ride
Now that we’ve determined a fund with an ESG tag marches to the beat of a somewhat different drum, we can look at what that ESG status means to investors. What, in addition to the non-monetary gain of making a long-term investment in a better world, are those investors getting? Higher returns? Less volatility?
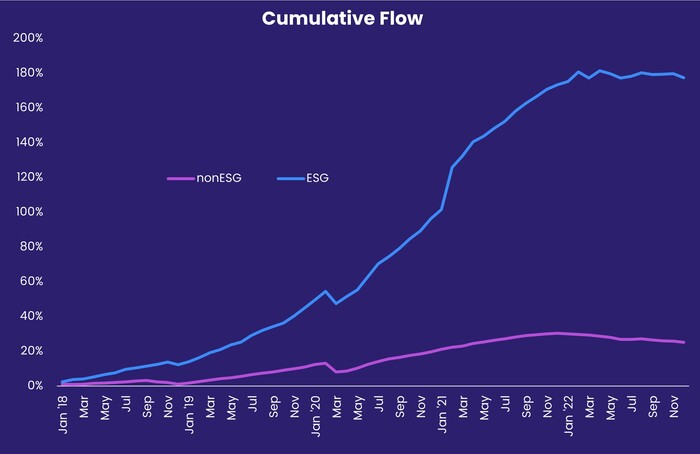
Investors certainly believe these funds offer value. The chart below shows the cumulative percentage flow into bond funds from the end of 2017 aggregated up into ESG and non-ESG buckets. It shows that, in relative terms, investors have favored SRI/ESG Bond Funds over non-SRI/ESG funds by a significant margin.
Another lens through which funds are frequently scrutinized is volatility. EPFR has a daily flows dataset that provides fund returns. From this, we can compute the weighted average daily return of ESG and non-ESG funds. This then yields the moving twenty-day annualized volatility measure plotted below.
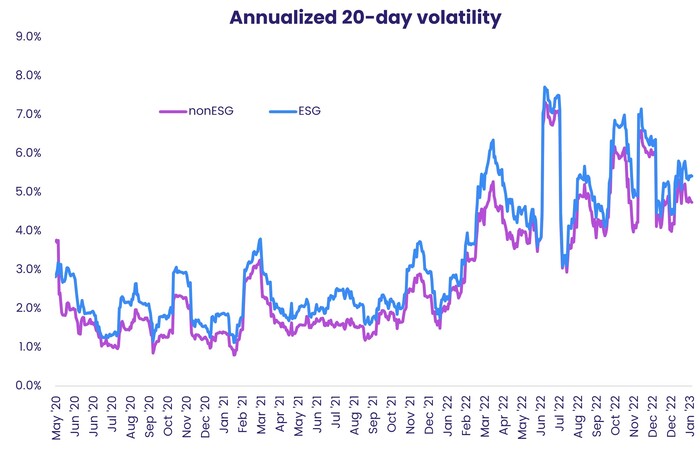
As the chart illustrates, although periods of high and low volatility affect SRI/ESG and non-SRI/ESG funds alike, the former group is – modestly – more volatile. One explanation for this higher volatility is the longer durations that SRI/ESG funds tend to hold their assets.
The bottom line
In a rising interest-rate environment, this longer duration has a cost. The chart below shows monthly cumulative return from the end of 2017.
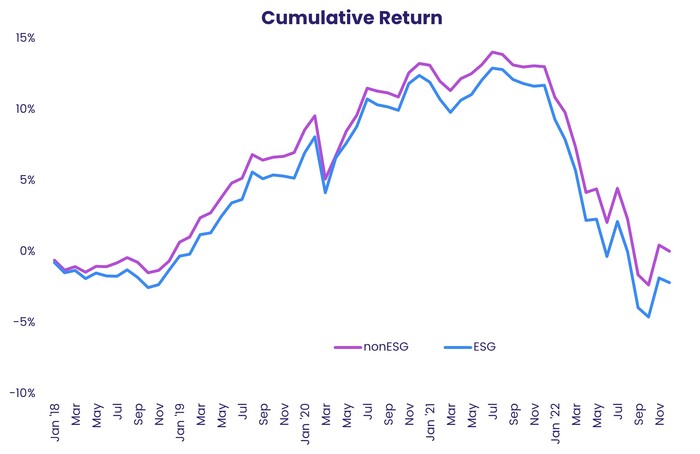
Over the past five years, the collective performance of SRI/ESG funds has lagged that of non-SRI/ESG Bond Funds. This matters, as SRI/ESG Funds usually have higher operating costs because of the need to screen potential investments. Once interest rates stabilize, however, the extra duration of ESG funds may stand them in good stead because long-duration assets historically outperform in falling rate environments.
Our basic analysis of the SRI/ESG Bond Funds tracked by EPFR confirms they are a coherent sub-group within the overall Bond Fund universe. But, what they deliver for those that invest in them is not so clear. When classic metrics such as performance, cost, volatility are applied, they lag their non-SRI/ESG peers.
Future blogs involving this asset class will explore factors that do – or have the potential to – improve the tangible outcomes for investors.
Did you find this useful? Get our EPFR Insights delivered to your inbox.


