Can quantitative lightning strike twice?
Srimurthy et al.[1] demonstrated the utility of fund flows as a predictor for equity markets at the country level. The model discussed in that paper uses flows into countries – expressed as a percentage of assets invested by EPFR-tracked equity funds in those countries – from funds that have a mandate to invest in more than one market, compounded over the latest available four weeks.
What happens when you apply the same approach at the currency level? Interestingly, it works. The only change required is that the Eurozone be treated as one big country.
To illustrate, we’ll look at the behavior of the US dollar over a period running from mid-June to mid-August. For the four weeks ending July 8, America’s currency enjoyed the highest cross-border equity flows among G10 currencies. Five weeks later, by August 12, the dollar had plummeted to the bottom bucket.
This blog explores why this happened and what it might portend for the dollar in future.
Same trap, different mouse
Using the same subset of the fund universe – equity funds with cross-border mandates — to compute flows for FX purposes is natural because:
- Cross-border – flows into single-country funds, overwhelmingly coming from the home country, generally cause minimal impacts on that country’s currency.
- Equity – flows into bond funds, thanks to their penchant for currency hedging, don’t impact FX markets nearly as much.
As mentioned, we need to treat the Eurozone as one big country because the countries in the union share a common currency. We achieve this by the simple expedient of consolidating the fund allocations to the constituent countries.
With that done, we can proceed with construction of the twenty-day flow indicator outlined in Srimurthy et al.[1] by taking the following steps:
- Allocate weekly flows and starting assets, pro-rata, amongst the various countries, proportionate to the country allocations of each fund and treating the Eurozone as one consolidated entity.
- Aggregate flows into – and assets held in – each country, using cross-border equity funds only.
- Weekly percentage flow, for each country, is simply the ratio of aggregate flow and starting assets.
- Compound weekly percentage flow over the latest four weeks to construct the final indicator.
We back-tested this indicator within G10 currencies over a twelve-year period ending in 2019 for various holding periods. At the beginning of each period, we ranked currencies into five buckets (quintiles) based on the latest-known values of the indicator, and held the position till the end of the period.
The table below shows the annualized returns to each quintile in excess of the equal-weight return for G10 currencies during each holding period. The column labelled “Sharpe” is the ratio of annualized average spread, scaled by annualized volatility, between the returns to the highest (Q1) and lowest (Q5) flow quintiles.
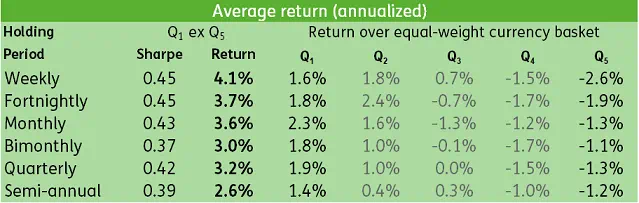
As you can see from the table above this indicator, applied to currencies, outperforms the equal weighted basket regardless of holding period.
The Phoenix, rising from the ashes, is not the dollar’s friend
In early July, when money had been pouring out of cross-border equity funds, the US dollar reigned supreme. Fear was good to the dollar.
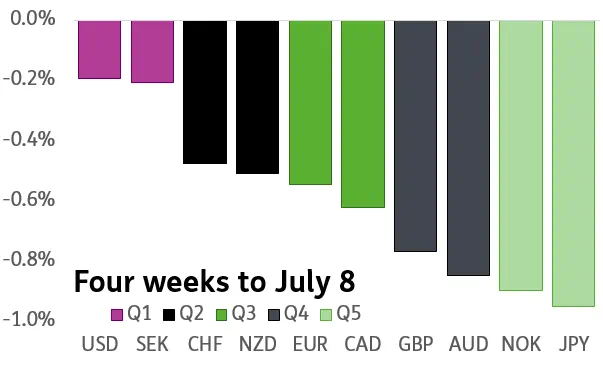
Now that fear is being replaced by greed, with every currency seeing inflows, the dollar is languishing in the bottom bucket.

How do we profit from this? Utilizing the indicator and going long and short the high-flow and low-flow currencies respectively will, over time, generate a decent excess return.
The recent past, however, suggests another, more subtle approach may be even more rewarding.
When the market has been fearful, coinciding with equity outflows from G10 currency areas, the dollar has ranked well. The opposite has been true during periods of greed (i.e. inflows into G10 currencies). This suggests that investors can use the dollar as a simple proxy for their broad view on the state of the global economy.
Those with a sunny outlook can express that view by going short the dollar. The more pessimistic can go long. Both will avoid the trading costs associated with multi-asset strategies.
Did you find this useful? Get our EPFR Insights delivered to your inbox.