For several years EPFR has, periodically, published an internally developed indicator to detect whether or not current conditions are consistent with previous bear markets. This indicator featured in one of the Quant’s Corners published in 2019. The response was mixed. Among the valid criticisms were the limited number of factors the original indicator is based on, and the difficulty readers of the blog had trying to understand on which side of – and how far from – a separating hyperplane (in the four dimensions represented by these factors) the latest datapoint stands. Perhaps the most valid criticism was the contemporaneous nature of the original indicator’s signal. What is the point of a signal that warns you of a bear market when the bear is already inside your house?
For these reasons, EPFR has reworked its ‘bear detector’ so that it predicts bear markets a week in advance.
Know your enemy
Everyone has a different definition of what constitutes a bear market. A standard one is a drawdown of around 20% in some major index. For the purposes of this article, weekly returns of the S&P 500 are used together with a drawdown threshold of 20% to indicate a bear market. To build the historical framework for the improved indicator, we look at the full history of S&P 500 weekly returns and isolate the consecutive weeks with the biggest drawdown in return. Should the cumulative drop exceed 20%, these are flagged as bear markets.
Astute readers will have noticed that whether a week falls in a bear market, or not, depends on the point in time from which bear markets are characterized. For instance, if, in the last three weeks, the market has dropped 19%, these weeks are not considered to fall into the bear market category. However, if the following week sees a further 5% drop, then the latest four weeks will now be characterized as a bear market.
Building the predictor: Basic building blocks
When building indicators, there tends to be a tradeoff between sensitivity and timeliness. On the one hand, you do not want your indicators jumping all over the place. On the other hand, it is important they move in response to market forces. We have noticed that four-week flow tends to offer a balance between sensitivity and timeliness. Throughout the rest of this article for each class of fund we look at, we will construct the following predictors:
- Flo – weighted average flow, expressed as percentage of assets under management, of the fund class compounded over a twenty-day period.
- Ret – weighted average percentage return of the fund class compounded over a twenty-day period.
- FloVol – volatility of weighted-average flow, expressed as percentage of assets under management, of the fund class over a twenty-day period.
- RetVol – volatility of weighted-average percentage return of the fund class over a twenty-day period.
Further, to avoid drawing conclusions on insufficient data, we will not consider any fund class with assets under management below $1 billion for any week after 27th April 2007. What fund groups should these predictors be derived from? EPFR’s broadest classification is by major fund type. There are five, namely Money Market, Balanced, Alternative, Bond and Equity. We ran panel regressions of the latest available 1/0 bear-market characterization against the 20 factors, lagged one week, derived from these five fund types. The chart below shows t-statistics for the regression with the highest r-squared.
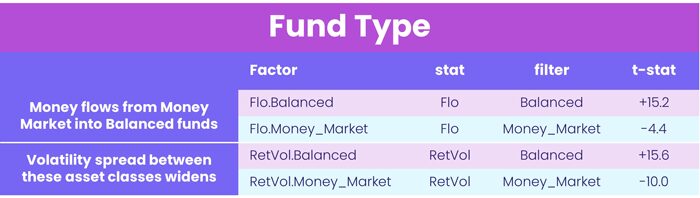
From the four factors above, the following two were constructed for the final predictor:
- Flo.BalExMMkt – 20-day percentage flow into Balanced Funds less that into Money Market Funds
- RetVol.BalExMMkt – 20-day return volatility of Balanced Funds less that of Money Market funds
Adding equity style to the mix
As we continued to build out the new predictor, Equity Funds were next to be analyzed. Funds were divided up into Large, Mid or Small Cap and then further subdivided into Growth, Value or Core. This together with the four factors computed from each class of fund produced thirty-six total to analyze. Panel regressions were always run in conjunction with the two factors identified in the prior section. The table below shows the set of factors which proved most predictive.
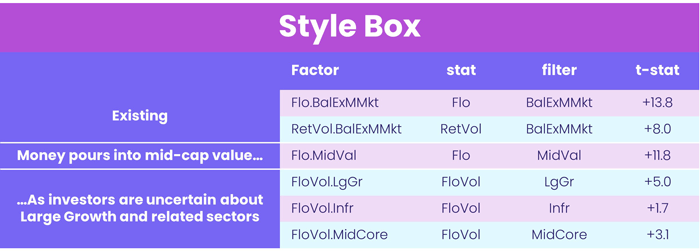
Besides Flo.MidVal, or 20-day flows into Mid Cap Value, the FloVol.LgGrPlus was also constructed for incorporation in the final predictor. This was done by considering Large Cap Growth, Mid Cap Core and Infrastructure as a single fund class and then computing 20-day flow volatility.
Geography and other ingredients
Next, we turned our attention to Bond Funds. The most predictive set, in conjunction with the four prior factors, is shown in the table below.
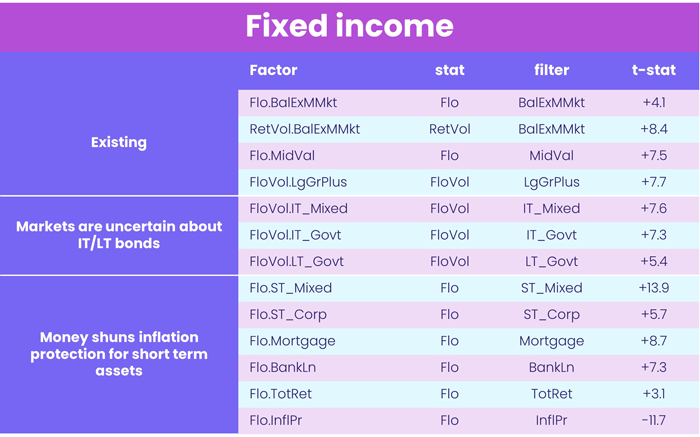
For our final predictor, we constructed two new factors:
- FloVol.GovtPlus – 20-day flow volatility of Intermediate Term Mixed and Government Bond Funds, together with Long Term Government Bond Funds, taken as a single class.
- Flo.STFixIncSprd – 20-day flow into Short Term Mixed and Corporate Bond Funds, together with Mortgage, Bank Loan and Total Return Funds all taken as a single class in excess of 20-day flow into Inflation Protected Bond Funds.
- Equity Sector Funds were next up. The most predictive set, in conjunction with the six prior factors, is shown in the table below.
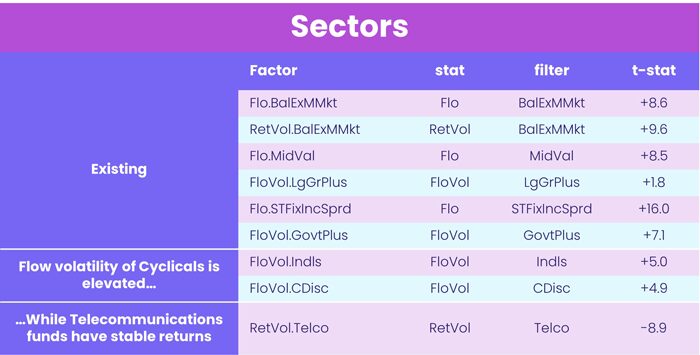
From these, besides RetVol.Telco, or 20-day volatility of Telecommunications Funds, we constructed FloVol.Cyclicals, taking Industrials and Consumer Discretionary as a single class. Finally, we brought in equity Geographic foci. The most predictive set, in conjunction with the eight prior factors, is shown in the table below.
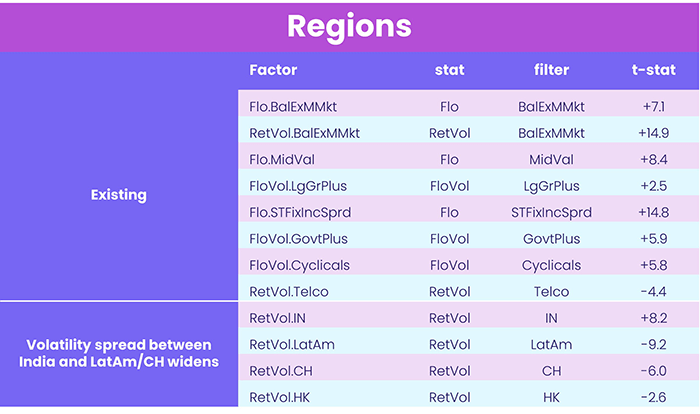
From the regional analysis we constructed one final factor, RetVol.Regional, or 20-day return volatility of India Equity Funds less that of Latin American, Swiss and Hong Kong (SAR) Equity Funds taken as a single class.
Building a better bear trap
With these factors in hand, the new and improved indicator can be constructed. Each week we compute a weekly history of bear markets based only on S&P 500 returns up to the end of that week. To this, the full history of each of the nine factors up to the end of the prior week is added. We then run a logistic regression of the 1/0 bear-market variable against the nine factors, lagged by one week. Using that model, together with the latest values of the nine factors, should predict the probability of a bear market. But does it? The line chart below shows estimated probability of a bear market the following week. The line is shaded pink if that week, from the standpoint of the present, fell in a bear market. Otherwise, the line is green.
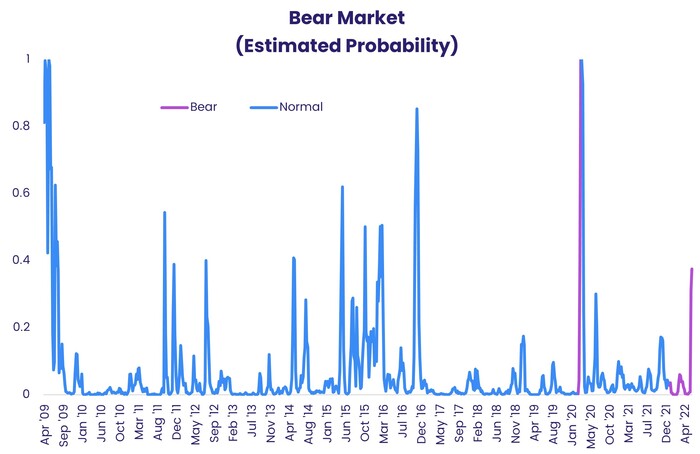
As shown in the chart, before both the current bear market, as well as the one in early 2020, the predictor spiked up above 20%. There are plenty of other times that the predictor has exceeded this threshold, so it is best used as a wake-up call to initiate further research rather than as a stand-alone indicator. Fund flows do capture shifts in market sentiment. With the right curating, EPFR data can give you time to rethink your strategies and exposure before the bear comes calling.
Did you find this useful? Get our EPFR Insights delivered to your inbox.


