Respect, for retail investors, is in short supply. For many finance professionals, they are the fools in the market, rushing lemming-like into meme stocks and assets coming off their peaks. Instead of buying on rumor and selling on fact, they are prone to doing the opposite.
This perception carries into the world of mutual and exchange-traded funds. Contrarian investors keep a close eye on the flows into and out of retail share classes – flows that are all too often dismissed as “dumb money”.
But, like all well-established assumptions, this one may reflect the past rather than the present. Is it possible that retail flows can actually be used for predicting market performance?
In this blog, we utilize some of EPFR’s oldest strategies to test the predictive powers of the retail flows captured in the universe of 150,000 mutual fund and ETF share classes encompassing some $47 trillion in AUM that EPFR tracks on a daily, weekly and monthly basis.
The answers will surprise many with an old-school view of retail investors.
Old machine, new sausages?
Quantitative analysis of EPFR’s data, which stretches back in some cases to 4Q95, has shown that flows into cross-border equity ETFs and mutual funds can be predictive of future returns of global equity markets.
The strategies that unlock these signals use the same basic methodology. They start with EPFR’s data which, in addition to flows, captures country, sector and industry allocations. On the flow side, the data is captured down to the share class level, allowing a distinction to be made between investment and redemptions by institutional or retail investors. In addition, each fund is classified based on characteristics including their asset class focus, fund type, country of domicile and geographic mandate. These features give the possibility to assess the sentiment of different investors towards fund groups and markets over time.
The EPFR retail flow percentage country indicator is calculated from a subset of cross-border equity mutual funds reporting daily flows and their country weightings. On any given day, the dollar flow into a fund’s retail shares is multiplied by their latest reported allocation to a country in question and aggregated across the fund universe. Similarly, the assets held by retail share classes are scaled by country weightings in the same way. Aggregate dollar flow normalized by aggregate assets under management for a country produces a percentage flow for the day.
Daily percentage flows are smoothed over a rolling 20-day period, and at the end of every week, all countries in the current MSCI ACWI index are sorted into quintiles. The highest 20-day percentage flows are assigned to quintile one, and the lowest to quintile five.
Finally, from 2008 until the end of 2021, the portfolio will go long the countries contained in the top quintile and short those in the bottom with equal weightings. Each of the countries traded correspond to an MSCI index and the index returns (total, net dividend) were used as a proxy for each country’s performance.
And the winner is…
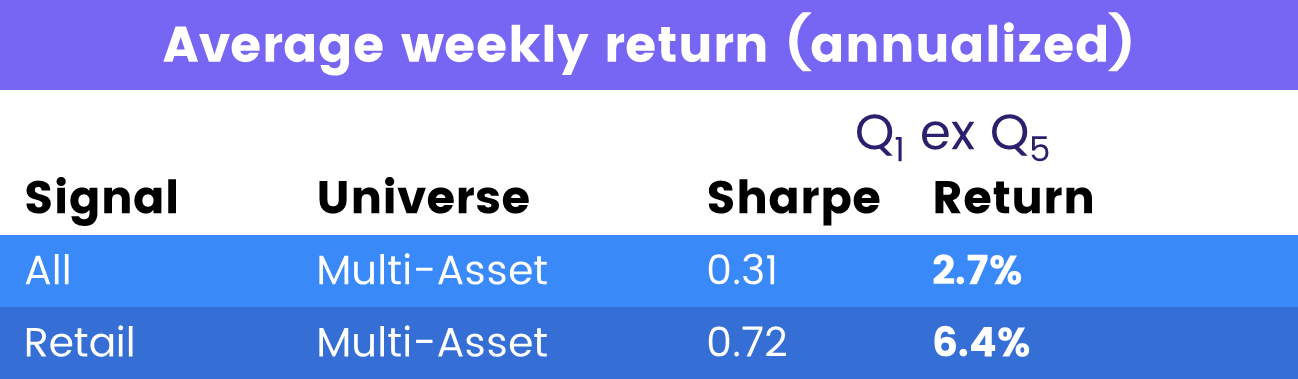
The following table displays the annualized Sharpe ratio and performance for the overall portfolio (Q1 ex-Q5). The results from the original flow percentage country strategy and the updated retail flow percentage country back-test are presented for comparison. In addition, Charts 1 and 2 below demonstrate each strategy’s calendar year returns.
These combined results demonstrate that:
- Overall, a percentage flow signal based on retail fund shares produces a more profitable strategy than one derived from all equity, cross-border ETFs and mutual funds.
- The retail results show significantly better calendar year returns from 2016 onwards.
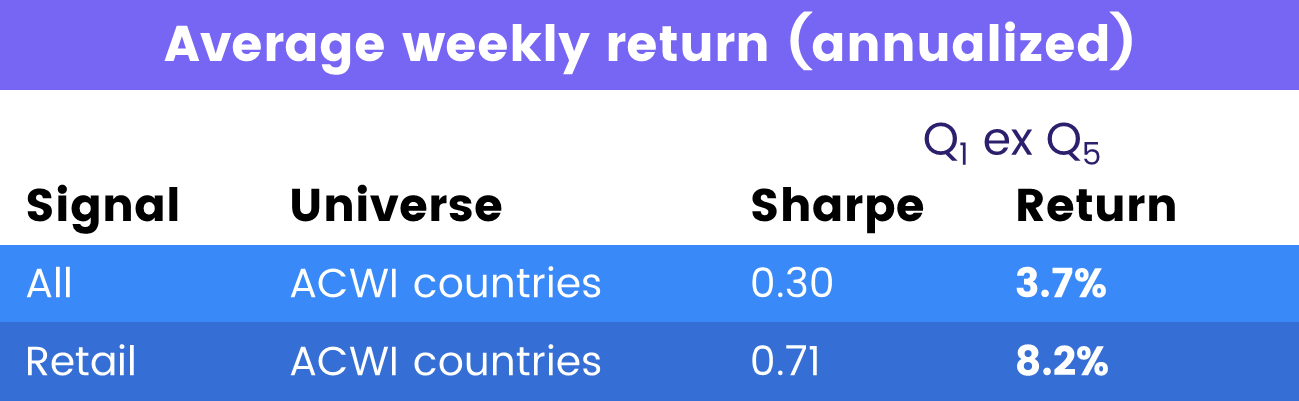
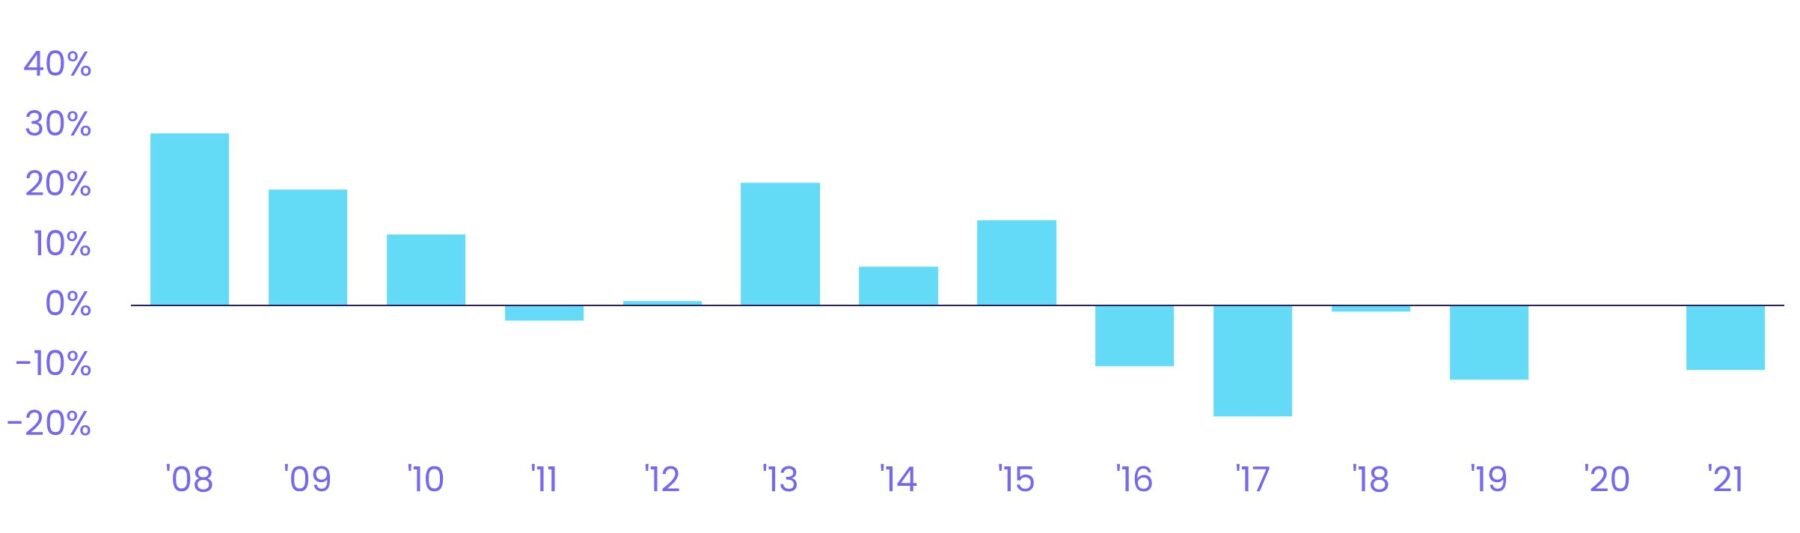
Chart 1: the annual returns for the original flow percentage country backtest
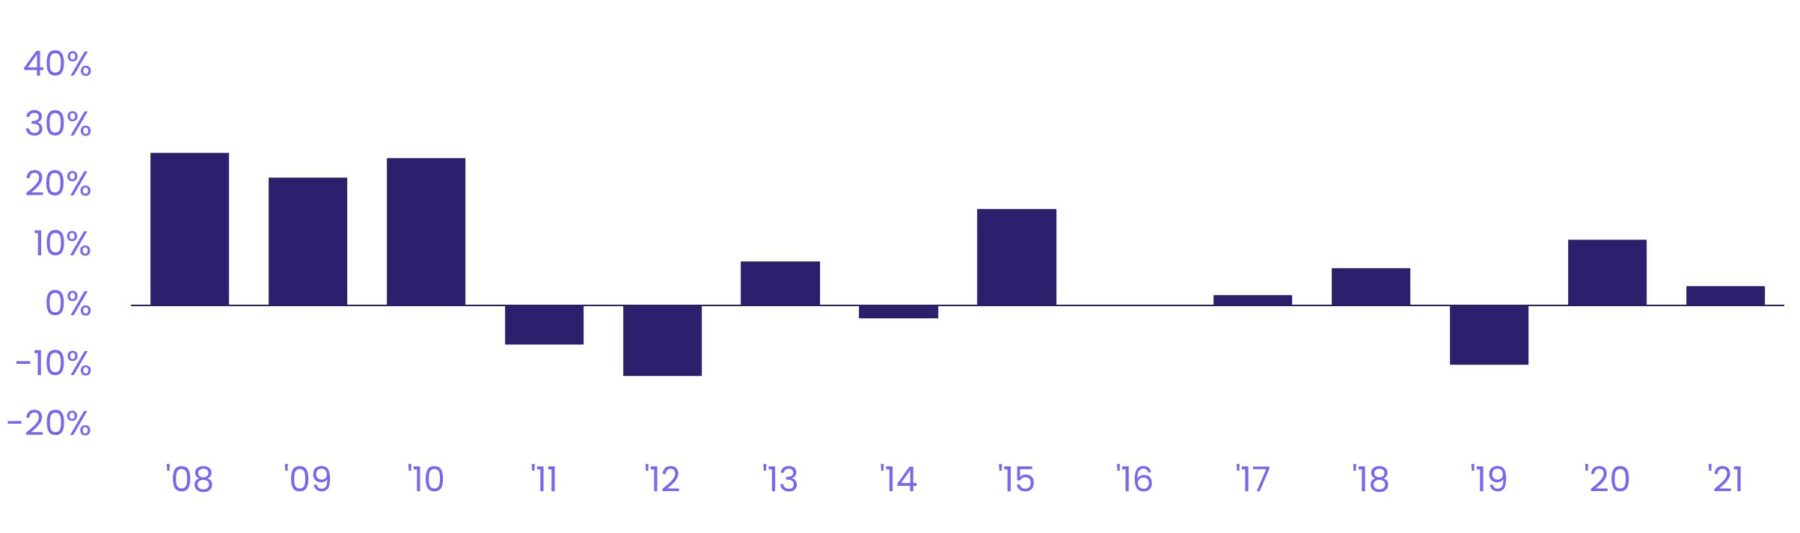
Chart 2: the annual returns for the retail flow percentage country backtest
Tuning the signal
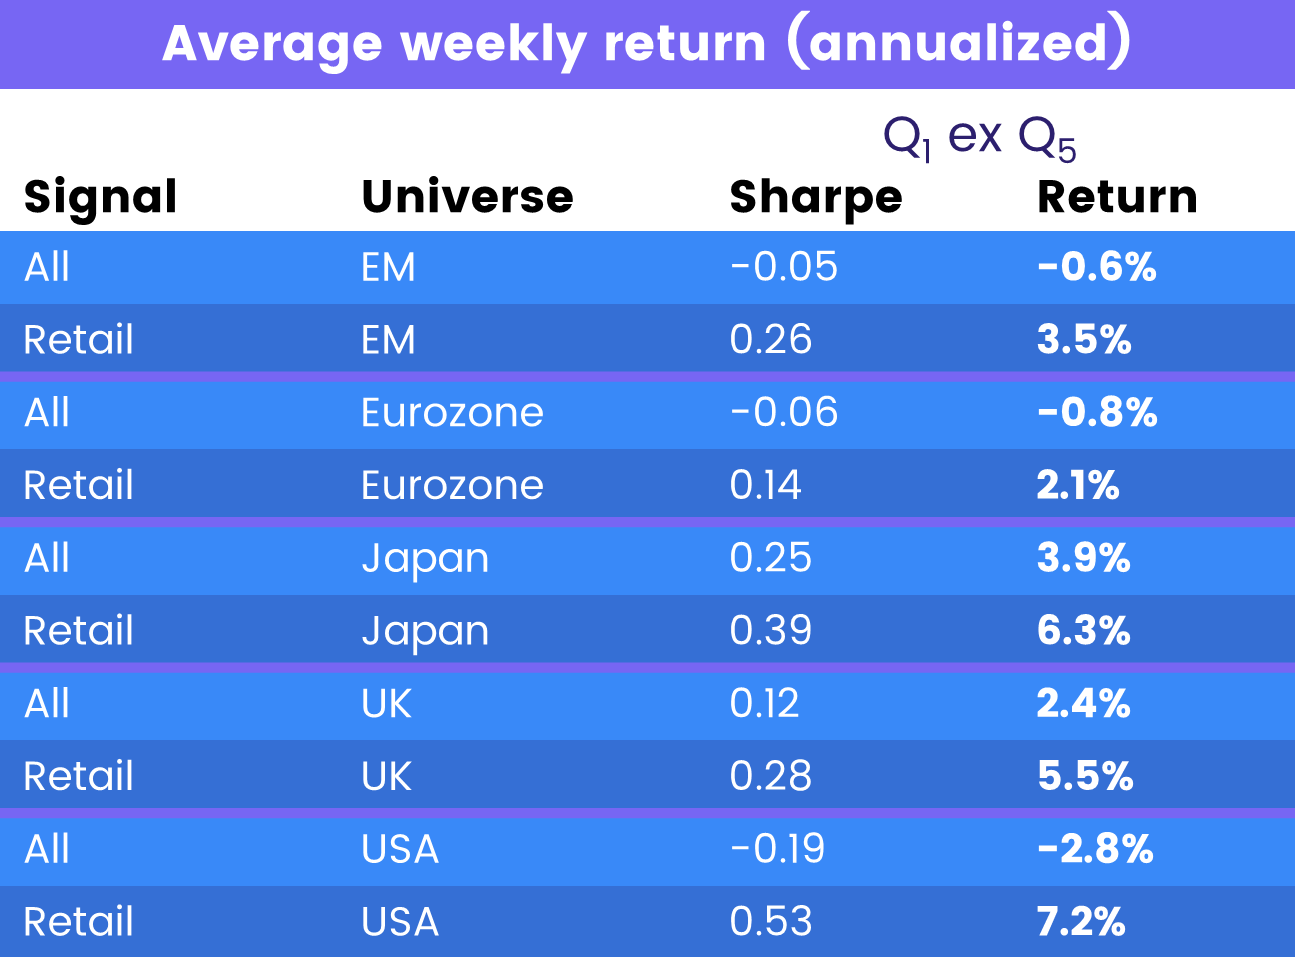
To further this analysis and confirm our findings so far, a similar signal was also tested within our Global 7 equity flow percentage back-testing framework. The idea here was to select the top and bottom equity regions, from a universe comprised of Asia ex-Japan, Europe ex-UK, Japan, Latin America, Pacific ex-Japan, UK, and US, in terms of retail fund share compounded percentage flows. As before, the portfolio is rebalanced weekly and will go long the regions in quintile one and short quintile five.
To calculate the indicator, the dollar flows to the retail shares of equity mutual funds mandated to invest in a particular region were summed, then divided by the total assets under management of the same funds’ share classes from the start of the day. Note that the original signal used for the Global 7 equity strategy is calculated across all ETFs and mutual funds.
Per the results table and Charts 3 and 4, these backtests also generated superior returns.
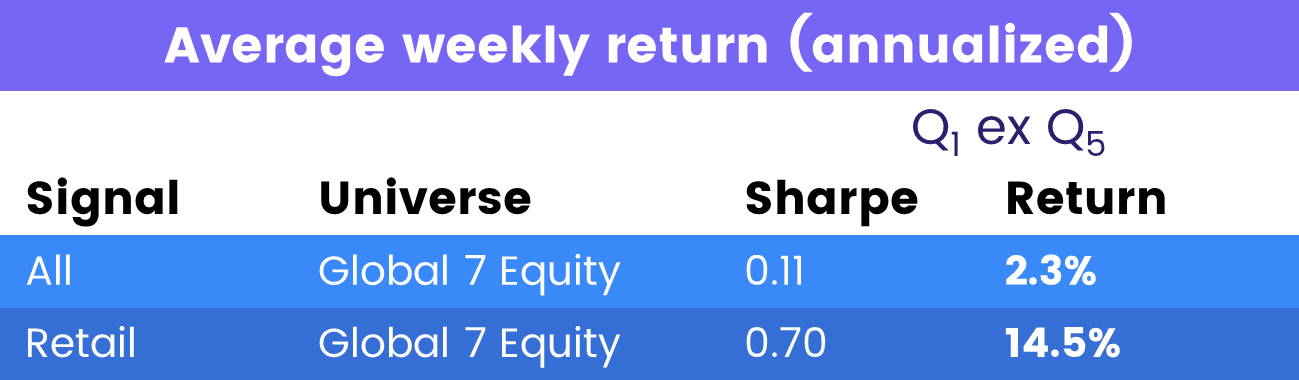
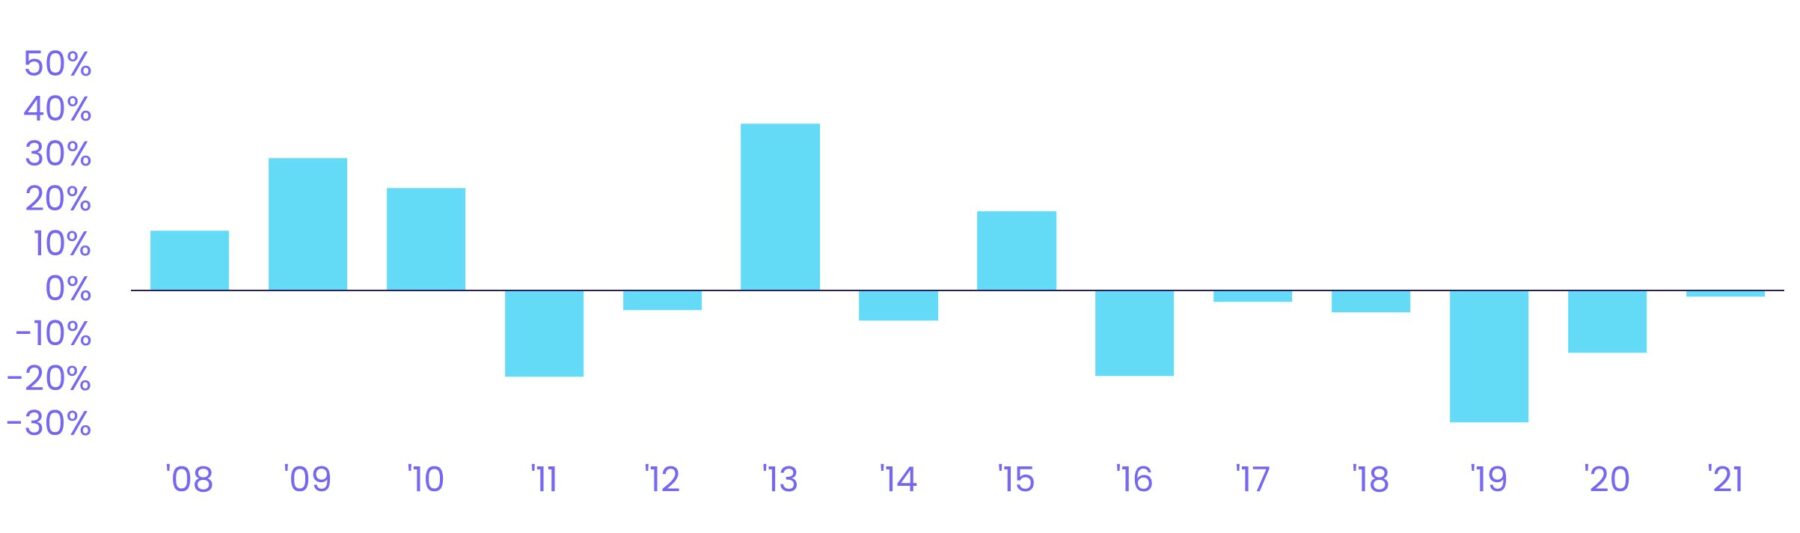
Chart 3: the annual returns for the original Global 7 equity flow percentage backtest
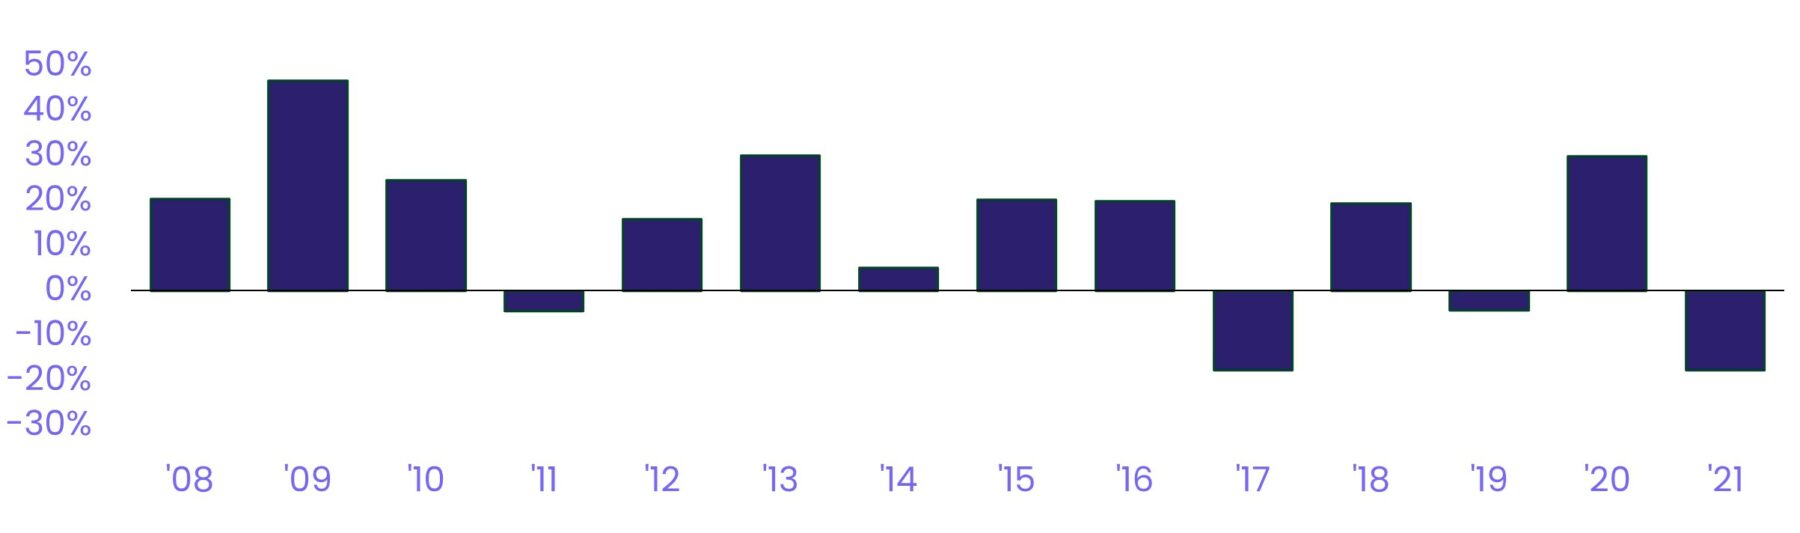
Chart 4: the annual returns for the retail Global 7 equity flow percentage backtest
Extending this to consider the retail percentage flows for the same seven equity regions, alongside an additional 10 fixed income asset classes, also improved our multi-asset flow percentage strategy results. The 10 fixed income groups added to the back-testing universe included GEM bonds, Western Europe bonds, high yield bonds, floating rate funds, Global fixed income, US municipal debt, US Treasuries – short, intermediate, long-term – and cash.
Sectors yes, FX no
A signal derived from retail share class flows was also applied to our flow percentage sector strategy in order to gauge how successfully it can predict the future performance of equity sectors. The methodology used to compute daily percentage flow into sectors within Emerging Markets, Japan, Europe, UK and the US follows a similar logic to that outlined for country percentage flows, but also incorporates EPFR’s monthly sector allocations information.
Backtests were run by ranking the twelve sectors for these five different geographical regions at the end of every week. As before, the original indicator against which we compare these results was constructed from flows to all funds.
From these results, we can conclude that retail percentage flows proved to be better predictors of forward returns across all sectors and regions.
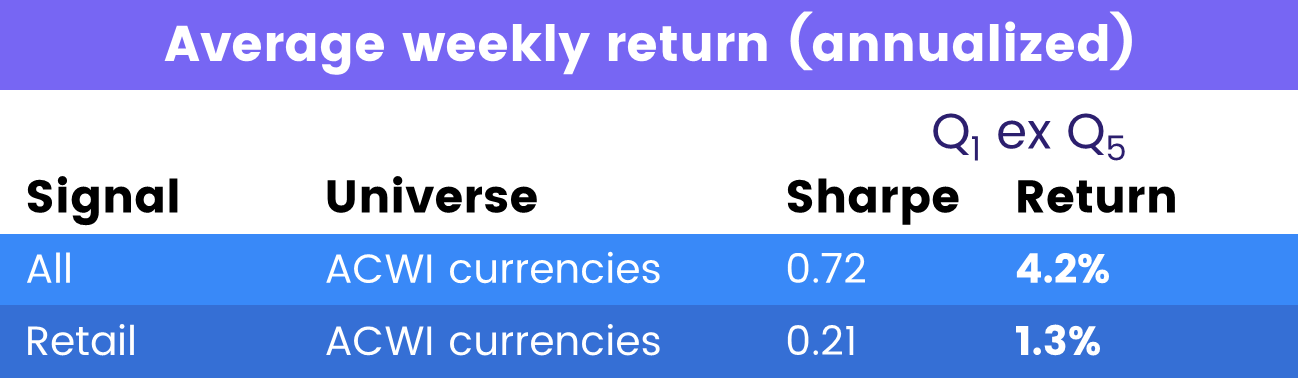
Finally, retail percentage flows were tested in a currency rotation setting, by selecting to go long or short ACWI currencies. This time, percentage flows into currencies based on flows to all funds and share classes and their respective country allocations was the better choice.
What was true yesterday
Our analysis clearly illustrates that the predictive value of retail flows is not limited to short-term contrarian signals.
Having established this fact using a standard, well-tried strategy that looks at relative factors, future Quant’s Corners will explore whether retail signals work within single asset classes or markets.
Stay tuned.
Did you find this useful? Get our EPFR Insights delivered to your inbox.


