As Europe’s sovereign debt crisis gathered momentum in 2009, several of the hardest hit countries were lumped together and referred to as ‘Club Med’ or PIIGS (Portugal, Ireland, Italy, Greece and Spain) markets.
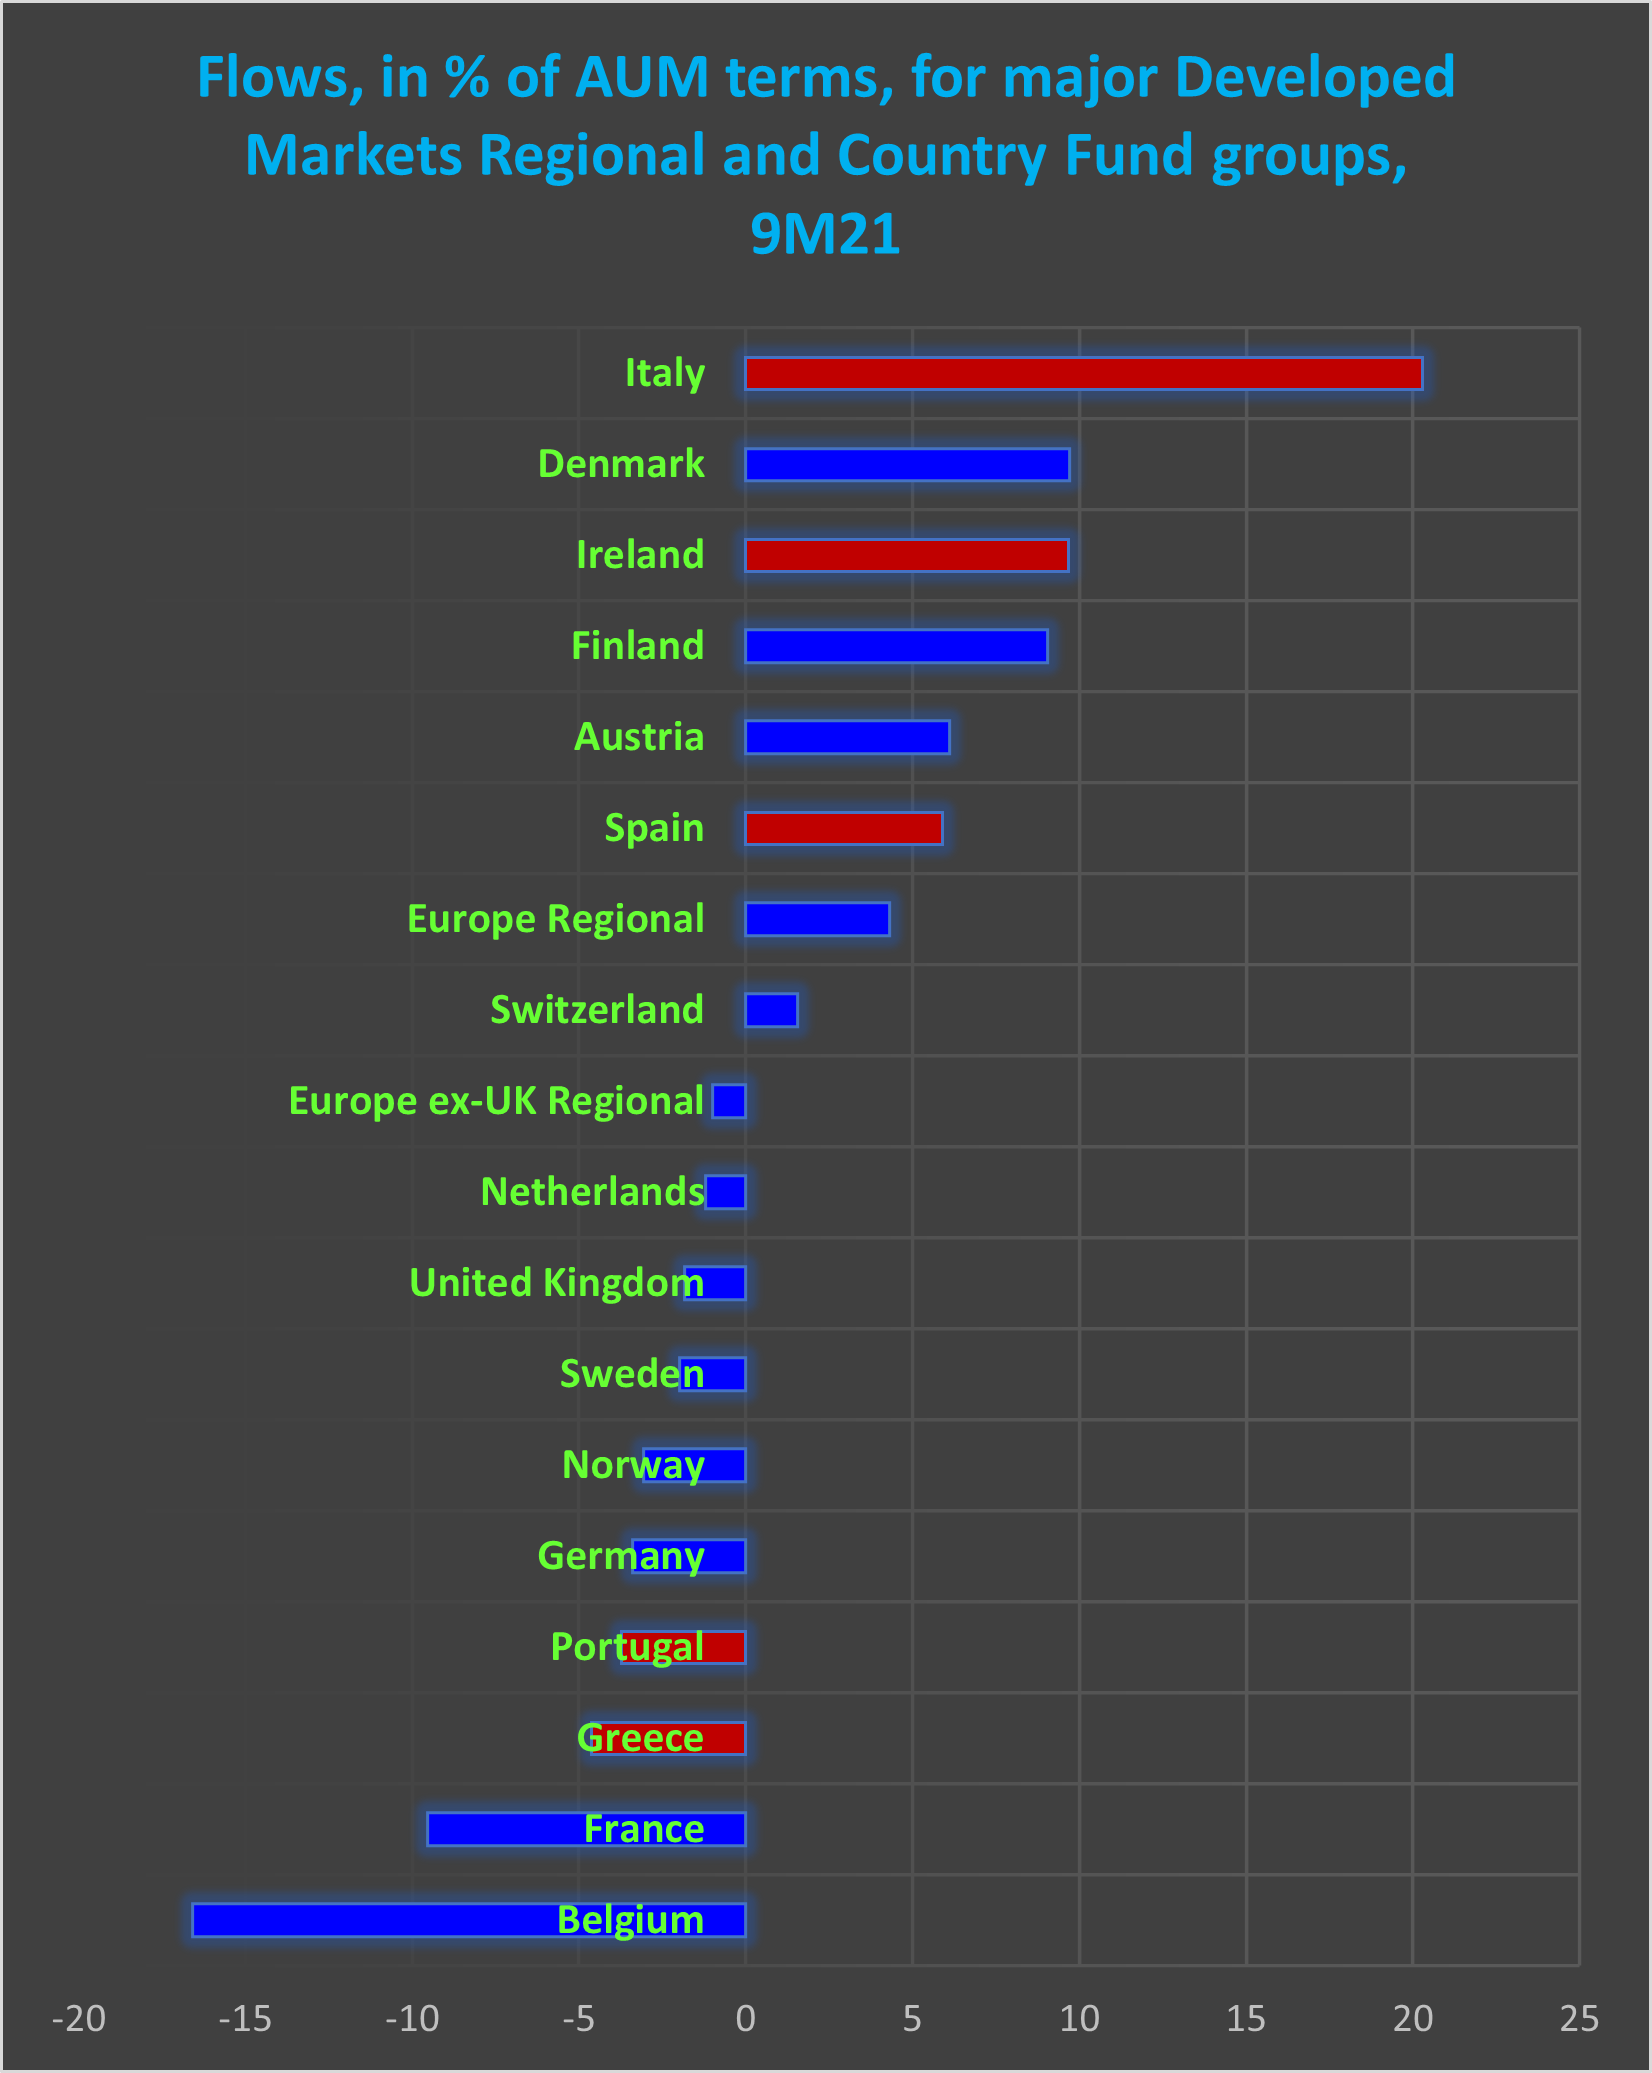
Names have consequences. Coming into 2021 the equity fund groups dedicated to the five PIIGS markets have suffered net redemptions totalling over $12 billion.
This year, however, there has been a shift. Buoyed by the competence assigned to Italy’s new prime minister, former ECB chief Mario Draghi, Italy Equity Funds are on track for their best year – in flow terms – since 2014. Greece and Italy Bond Funds have recorded net inflows year-to-date, as have Spain and Ireland Equity Funds.
This enthusiasm for exposure to Europe’s southern tier raises many questions. In this blog post, we will utilize the expertise of guest contributor Quantitative Insights (Qi) to tackle one of them – are these shifts responding to macro regimes or to some other factors?
A crowded toolbox
Previous guest posts by Qi have focused on its tools for gauging an asset’s sensitivity to a range of macro factors. How is that security impacted by global growth or inflation expectations? How it is affected by changes in financial conditions, like the shape of the yield curve or the level of real yields?
Distilling these sensitivities into a measure of valuation makes it easier to identify when an asset has become rich or cheap versus its macro environment. In this blog, we take a closer look at changes in some of the macro factors themselves and what that tells us about recent trends in southern tier European markets.
The list of individual factors is too long to detail here – each of Qi’s models incorporates around 30 — but they are transparent and fall into three broad buckets: economic fundamentals, financial conditions, and risk appetite.
The Qi methodology looks at factor moves in Z-score terms. This affords two key benefits. It enables the ‘use’ variables with different units of measurement – basis point shifts in inflation expectations versus, for example, US$ per barrel in the case of crude oil. It also removes the problem of stationarity – all the ‘trend’ has been removed.
Sovereign debt repriced….
The chart below looks at Qi’s “Eurozone Sovereign Confidence” bucket. It uses asset swap spreads on Italian, Spanish and Greek government bonds as a measure of stress in Europe. In principle (a) the sovereign should be the risk-free rate and (b) interest rate swaps will yield more than government bonds.
A positive number implies normality while inversion and a negative number means the sovereign is stressed. During the European debt crisis, worries about Greek or Italian debt pushed government bond yields significantly higher. This was a good, real-time measure of market fears about the peripheral’s fiscal situation.
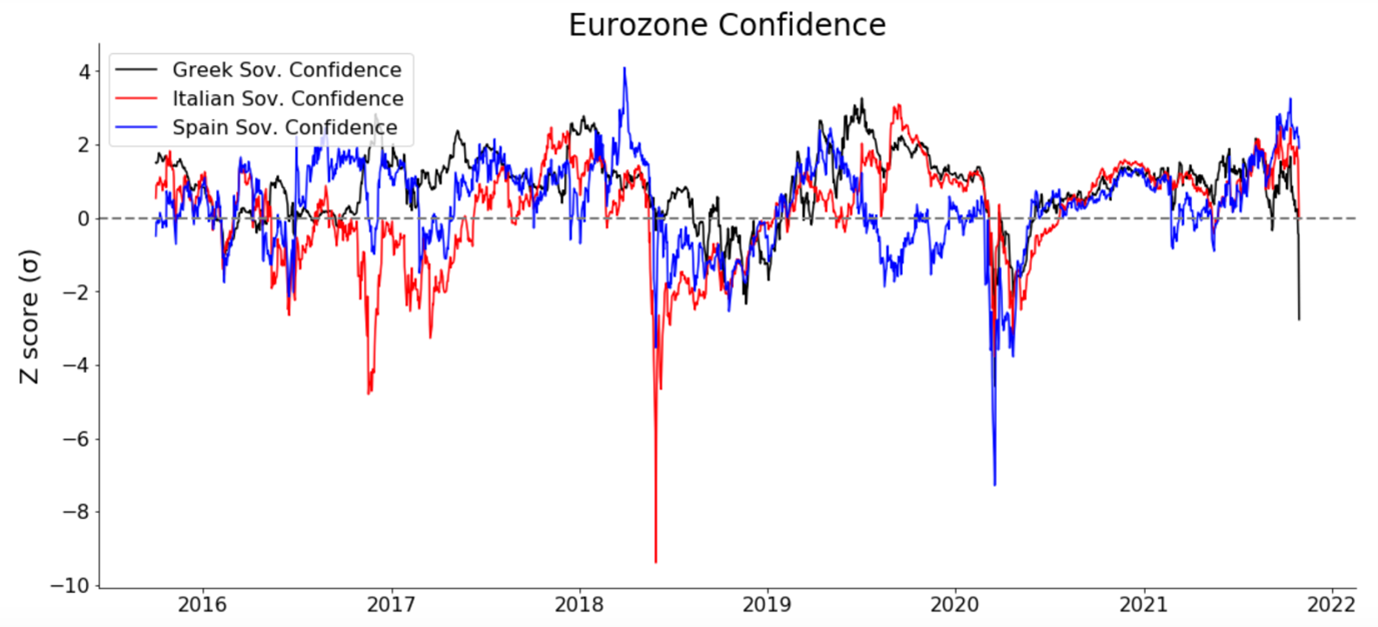
It is noticeable that, after a prolonged period of calm, sovereign confidence is waning once again. In the case of Spain, the retracement is minor. For Italy asset swap spreads have reverted to their long -term average. However, in Greece, spreads have moved significantly below trend.
It is not like 2012 when, at times, it felt like the very existence of the single currency was being questioned. It does, however, suggest that the market’s recent re-pricing in the face of rising inflation has had a material impact. Even with its recent — and explicitly dovish forward guidance — the ECB has not been immune from this re-pricing.
…. but what price regime change?
In isolation this amounts to a tightening of financial conditions. By including these factors in Qi’s European equity models for example, the degree to which tighter credit is impacting the peripheral European markets can be gauged.
The chart below shows Qi’s model for Spain’s benchmark equities index, the IBEX 35. The profile of Greece’s Athex Composite is almost identical. Both are in macro regimes, and both are very close to model fair value, i.e., they are behaving in line with macro fundamentals.
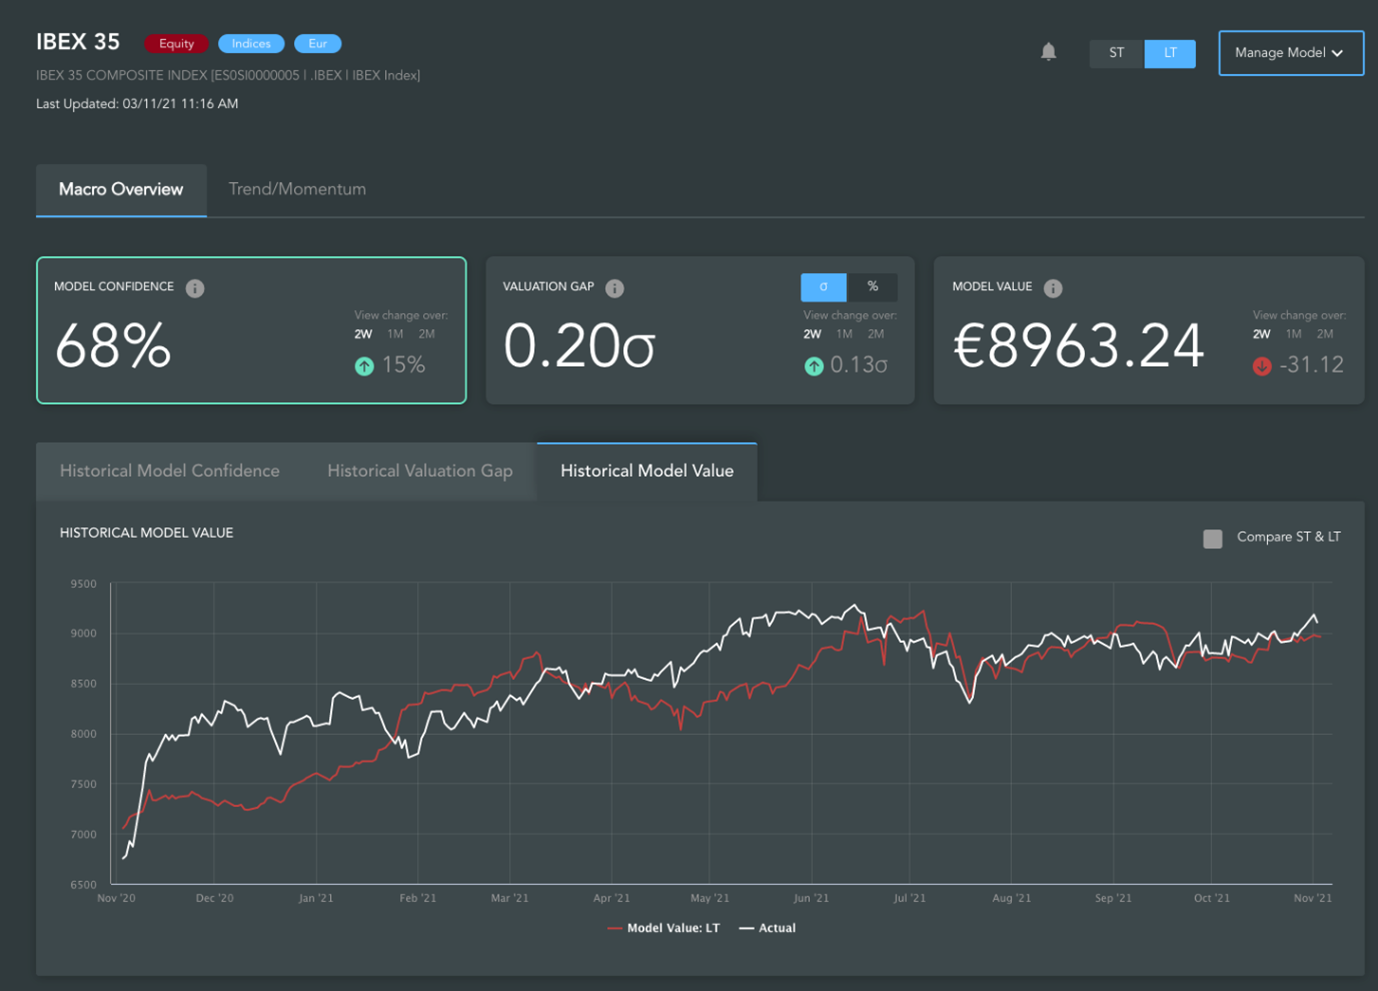
The move in peripheral asset swap spreads is one factor amongst many. In Qi’s models each relationship is orthogonal: headwinds from one factor are offset by tailwinds from another. The net result is a real-time picture of the overall macro picture. In this instance, the move in government bond spreads is not hurting Spanish and Greek equity markets.
Meanwhile, Italy’s FTSE-MIB is not currently in a macro regime. It is being driven by other, non-macro factors. Among these are the surge in portfolio capital flows captured by EPFR’s data. The current patterns suggest flows are a bigger driver of Italian equities than macro.
Capturing an established pattern
Discretionary investors in effect look at the world in the same way Qi’s models do. Having concluded whether an asset is rich or cheap in valuation terms, the next consideration is often the degree to which that is view is already priced by the market.
In the case of Europe’s southern markets, tensions between fair value and the existing macro regimes are rising, but they have not escaped those regimes.
This article was written by Cameron Brandt and Huw Roberts, Research Director at Quant Insight
Did you find this useful? Get our EPFR Insights delivered to your inbox.


