Most journeys begin with a destination in mind and a plan of how to get there based on the best, currently available information.
Climbing into a car and entering your destination into MapQuest or a similar program usually gets you where you planned to go. But that is not true of the investment process, where the destination – a certain rate of return – often eludes highly intelligent people with access to state-of-the art datasets and models.
EPFR offers both data and models that a wide range of clients use for purposes ranging from quantitative modelling to gauging relative and absolute investor sentiment towards different asset classes.
This Quant’s Corner will explore the gap between destination and arrival in the investment process using EPFR’s Stock Flows & Holdings data, and create a new quantitative factor – called Share Surprise (ShsSurp) for the purpose of this piece – that unlocks additional value.
Getting from A to B and a quarter
EPFR’s database has fund-level stock holdings and allocations that are updated on a monthly T+26 frequency. All the funds in our database also report monthly flows that are updated on a T+16 frequency. For the purposes of this analysis, we use the subset of those funds that reported holdings for both the current and prior months.
Given that the average month change in the shares held by these funds is around 6%, projecting an unchanged allocation and adjusting the number of shares held by proportionally allocating the latest month’s flows creates a credible yardstick for measuring the degree of “surprise” created by the gap between expected and actual holdings of individual stocks.
To capture this, we first calculate Adjusted Shares. In layman’s terms, this represents the total shares held, across all these funds holding each stock, had there been no flow. To get there, for each stock, we allocate flows over the prior month according to the fund’s current weight in the stock, then sum across all the funds. Scaling the result by the stock’s price at the end of the current month yields the adjustment factor. Subtracting this price-adjusted number of shares from the total shares held by all funds at the end of the month gives us the Adjusted Shares number for each security.
To capture the deviation – or “surprise” – for each stock, we perform the following calculation:
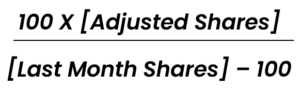
The bigger the number for a given share, the bigger the surprise factor.
On the contrary, it works
We ran quintile back tests on Shares Surprise for the constituent stocks in three domestic indexes (S&P 500, Russell 1000, and Russell 2000) and three international indexes (MSCI EAFE, EAFE SC, and EM). Each month, we ranked stocks into quintiles based on Shares Surprise so that each bucket has an equal number of names. The first bucket – Q1 – contains stocks with the highest values of Shares Surprise, while the last bucket – Q5 – has the stocks with the lowest values. Each quintile portfolio is then held over the full month.
We did this for Shares Surprise computed on all funds – ShsSurp – as well as Shares Surprise computed on active and passive funds only – ShsSurpAct and ShsSurpPas, respectively.
The table below shows annualized mean returns to the equal-weight basket of stocks that have the highest Shares Surprise in excess of that to stocks that have the lowest (“AnnMn”) between July 2011 and December 2023. The row labelled “Sharpe” is simply the annualized mean scaled by the annualized standard deviation across time. The column labelled “xUniv Avg.” is the equal-weight average across all universes except for the S&P 500. This is done to avoid double-counting large-cap U.S. stocks. Domestic universes are sector neutral (each bucket has the same number of names in each sector) while international universes are neutral to both region (Pacific/non-Pacific) and super sector (Cyclicals/Defensives/Financials).
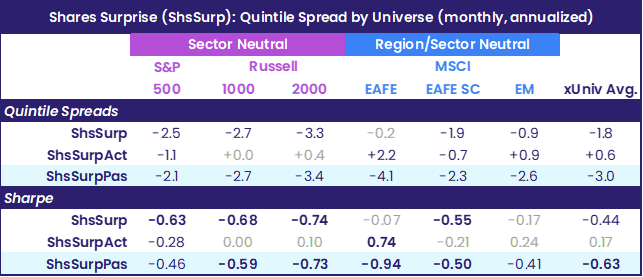
As you can see from the table, Shares Surprise consistently underperforms in each of the six universes. Moreover, the underperformance is driven by passive funds. Shares Surprise computed on passive funds is a much better contrarian indicator.
In the real world
One explanation for this factor’s success as a contrarian indicator, particularly for passive funds, might be that it is picking up on index changes. When a stock is added to an index, passive funds must buy it, resulting in a positive Shares Surprise. Informally called the “S&P 500 curse,” there is a known tendency for stocks to underperform shortly after they are added to that index.
As an example from last year, Insulet Corp. replaced SVB Financial Group in the S&P 500 prior to the opening of trading on Wednesday, March 15. By the end of 1Q23, all the index funds tracking the S&P 500 had added that name.
ShsSurpPas for that firm at the end of the quarter was 47.08871. This was known by late April, so Insulet landed in the top quintile at the end of April ’23. In May, Insulet’s return was -13.77% return, a full 10% behind the equal-weight S&P 500 return of -3.78%.
By providing a contrarian indicator, EPFR’s latest quantitative factor, Shares Surprise, guides the investment community to arrive at their destination by following the paths less traveled, or in other words, doing the opposite of what majority of investors are acting on. There are many factors EPFR has explored or has yet to discover, and in future Quants Corner editions, we hope to continue providing investors with strategies that have a clear destination.
Did you find this useful? Get our EPFR Insights delivered to your inbox.


