EPFR currently tracks over 133,400 shares classes offered by mutual, ETF, hedge funds and other vehicles that encompass over $46 trillion worth of assets. A small but rapidly growing part of this universe is occupied by Collective Investment Trusts, better known by the acronym CIT.
Like ETFs and mutual funds, CITs are pooled investment vehicles. Unlike ETFs and mutual funds, CITs are not regulated by the SEC and not open to retail investors (though they can get access through qualified retirement plans). For providers, this lighter regulatory touch means that CITs are easier to open, have smaller compliance burdens and – often – charge lower fees. One of those providers describe CITs as “combining the cost savings of a separately managed institutional account with the convenience of a mutual fund.”
From a quantitative perspective, the amount of assets sitting in CITs is still relatively small. But, given the speed with which they are growing, it behooves us to look at how these vehicles behave relation to the bigger fund universes before they reach a critical mass.
Growing numbers, growing demand
EPFR’s CIT coverage reached the $200 billion mark in July 2019 and the $800 billion mark in January 2021. The chart below shows number of CITs (pink line) and their assets under management (green line, billions USD).
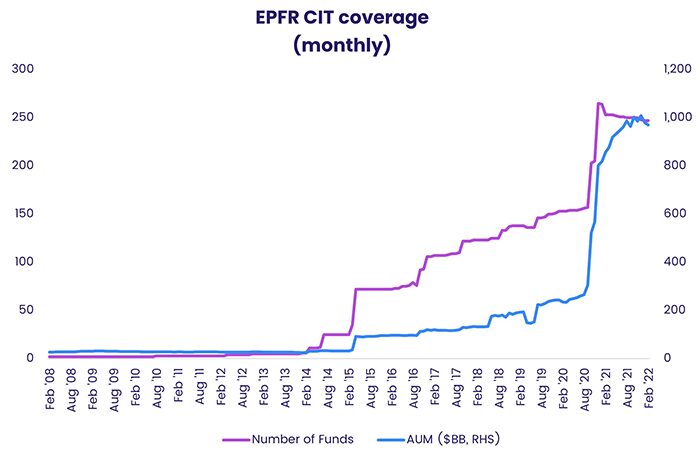
Although this jump in CIT coverage reflects the addition of previously uncovered funds to EPFR’s database, it also reflects the growing appetite among investors for these vehicles. Over the past two years, CITs have attracted more assets in relative terms than exchange-traded or mutual funds.
The chart below shows monthly asset-weighted fund flow, expressed as a percentage of AUM, for each of the three vehicle types, compounded from July 2019.
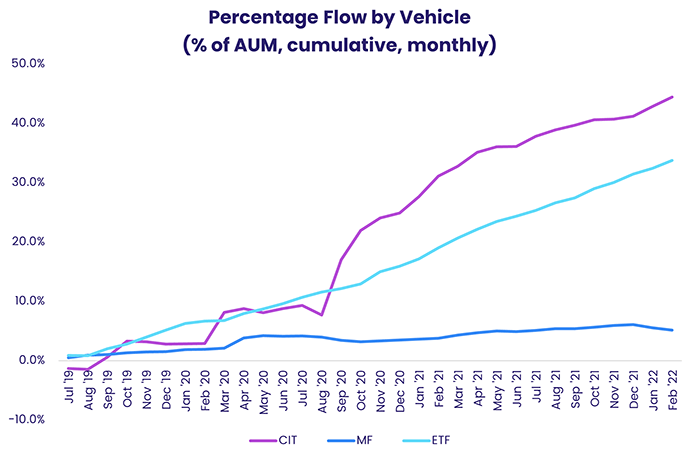
As you can see, CITs — at least those covered by EPFR — have attracted more assets than even the storied ETFs, over whose rise much ink has been spilt.
A focus on Equity
EPFR classifies the funds it tracks by fund type, whether a fund is an equity, a bond, a balanced, a money-market or an alternative fund, and then by mandate. After that, the data is organized so that a range of filters that include domicile, active versus passive, investor types and key themes such as SRI/ESG can be applied.
Currently, given our binary classification scheme, CITs are considered mutual funds in our data base, primarily to distinguish them from ETFs. The table below shows the number of funds covered, together with their assets under management (billions USD), by Fund Type, at February 2021.
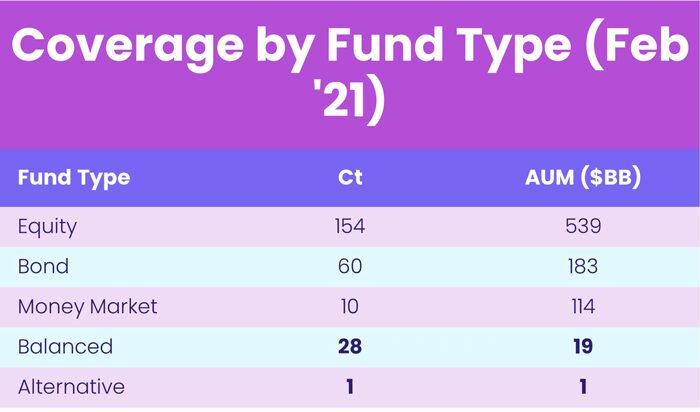
As this table illustrates, the bulk of the CITs covered by EPFR are equity funds.
The universe of CITs can also be broken down by their geographic mandates. The table below shows the number of equity funds covered, together with their assets under management (billions USD), by Geographic Focus, at the end of February 2021.
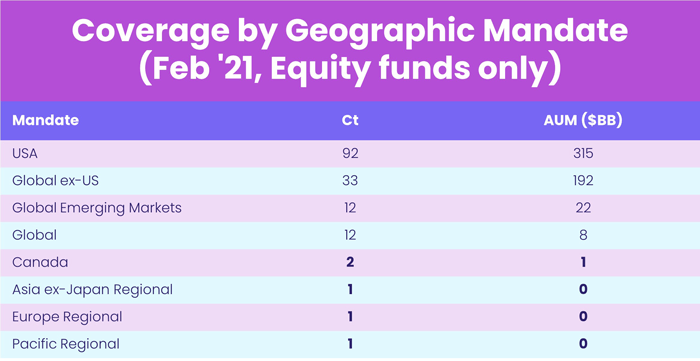
Of these equity CITs, the vast majority adhere to US or Global mandates.
In harness or out of harness?
As a precursor to some complicated analysis, it is important to answer a basic question: Do CITs behave the same way as their exchange-trade or mutual fund counterparts?
To answer this, we turned to principal components analysis (PCA) to find out.
For Global, Global ex US, Global Emerging and US Equity Funds, we focused on asset-weighted monthly returns from July 2019 to February 2021. We did this for each of the three different vehicles, namely CITs, ETFs, and mutual funds, applying PCA to the universe of funds we created.
Think of each of these 12 equity fund sub-divisions as an asset class. Of all the linear combinations of these assets, having squared weights summing to one, one of those combinations exhibits the greatest volatility. This, which can also be viewed as the biggest risk factor, is the first principal component. The second principal component is the next biggest risk factor that is uncorrelated with the first.
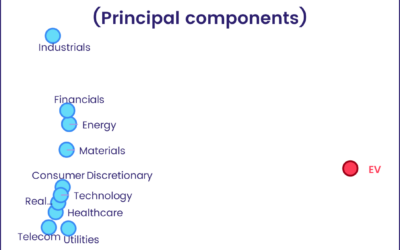
We computed the factor loadings of each of the 12 asset classes on the first two principal components and plotted the exposure to the second principal component against the first. In this way, we end up a two-dimensional display that captures the most risk.
As you can see from the chart below, our PCA shows that region trumps vehicle: funds exposed to a particular region share the same risk profile regardless of whether the vehicle is a CIT, an ETF, or a mutual fund.
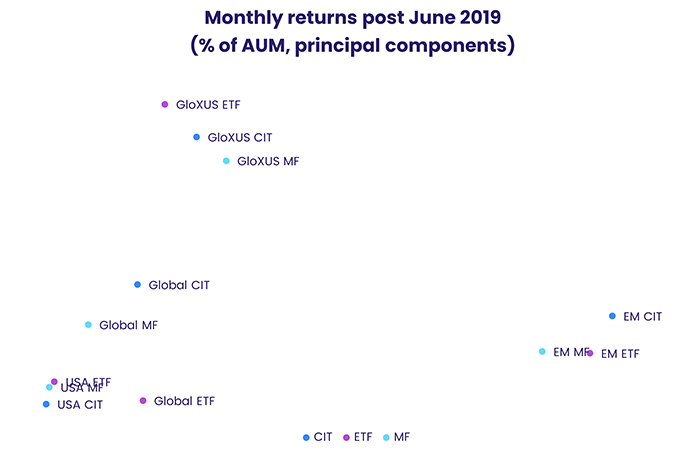
This suggests that, for quant research, CITs still enjoy a high degree of correlation with mutual funds and ETFs sharing the same regional mandates. For the sophisticated investor, it suggests that CIT’s offer a low-cost way to get exposure to equity markets in lieu of mutual funds that does not entail significantly higher risk.
Watch this space
While the AUM managed by EPFR-tracked CITs still represent less than 2% of the total AUM for all funds, their popularity is surging. By some measures, nearly half of the assets in target date strategies are now parked it CITs.
If CIT flows retain their current trajectory, there will be more data to work with and greater demand from investors, providers, custodians, and regulators for cross-vehicle analysis.
Did you find this useful? Get our EPFR Insights delivered to your inbox.