Until now, the majority of the strategies developed and back tested by EPFR’s Quant Team have been based on the concept of selecting and rotating between different markets or asset classes. Under this methodology, asset classes, countries or sectors are ranked based on EPFR-derived signals and then bought, ignored or sold based on their relative ranking.
In this Quant’s Corner, we utilized the same indicators. But this time we used them individually to create time series signals. Our goal: to determine whether they can also be successfully used to indicate appropriate entry (and exit) points into different equity and fixed income markets.
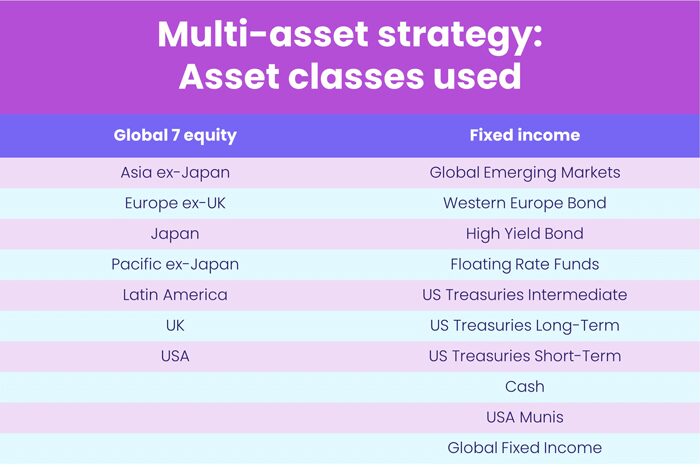
The indicators/predictors that were tested are based on aggregations of EPFR’s daily mutual and exchange-traded fund flow and starting assets data. By leveraging our fund-level tagging, signals were constructed across the seventeen different asset classes listed below.
The nuts and bolts
The underlying universe of funds that the predictors are based on are defined using three key fund characteristics:
- First, standard fund type classifications allow us to aggregate all funds in EPFR’s universe with an equity, bond, or money market focus, with the latter of which was used to create the “Cash” fund group.
- Next, EPFR’s taxonomy allows us to divide up the equity funds into seven regions based on the geographic area those funds target their investments. This geographic focus tag was also used to split up bond funds according to specific regions.
- Finally, again within the bond fund universe, style and sector characteristics that identify the type of debt a bond fund focuses on – including the duration, quality, issuer type, and so on – allows for further refinement of our raw material.
The flow percentage signal is then constructed for each asset class by first summing the flows to all funds contained in the group. The aggregate dollar flow is subsequently normalized through a division by the total dollar amount of beginning assets sitting in the fund group. The daily indicator for each asset class is then smoothed by compounding over the latest-available 20 days and a two-day lag is also applied to account for the reporting frequency of EPFR’s daily fund flow data.
The idea underpinning the subsequent back test of the predictor was that we decide to invest in the market represented by the EPFR flow percent aggregation for a five-day period whenever the compounded signal crosses above a defined threshold ranging from -5% to 5%. Trading only occurs on the final day of each week during the period spanning January 2008 until the end of 2021.
The forward five-day returns incurred following the end of any week whose 20-day flow momentum is seen to have crossed the threshold are collected and analyzed to measure the success of that asset class’ flows in timing market entry.
Who makes the initial cut?
The table below shows the Sharpe ratio achieved for each asset class, across the different thresholds defined above. Rows containing NA indicate that the market’s compounded flow percentage signal did not cross above the stated threshold in the left-hand column throughout the period tested.
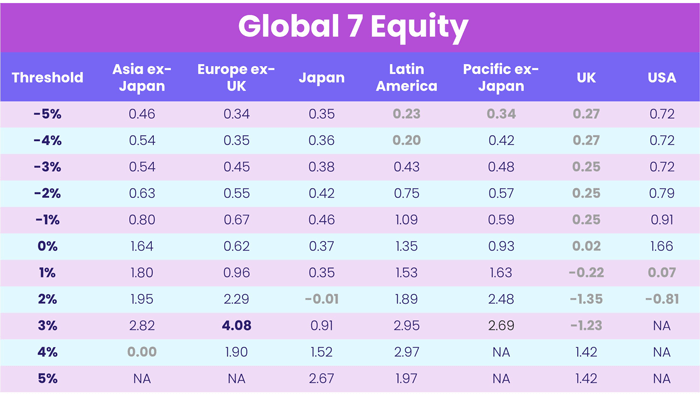
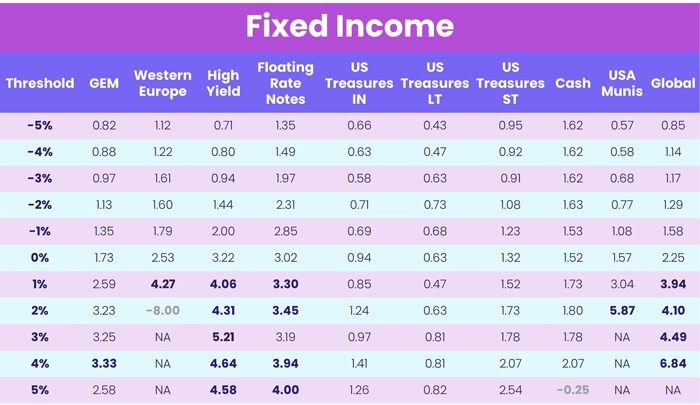
Table 1: the annualized Sharpe ratio achieved for the back tests against each of the 17 asset classes and percent thresholds between -5 and 5% tested using EPFR’s percentage flow signals
At this stage, we observe that the strategy worked best as a time series signal within the Europe ex-UK region of equity markets, and the High Yield, US Municipals and Global fixed income markets.
Tuning the signal
The next step of the analysis looked to optimize the signal by breaking down and re-calculating the aggregations for each asset class across ETF and mutual fund universes separately. This step produced thirty four new predictors to analyse, the results for which are summarized below. The table reports the maximum Sharpe ratio and percent threshold attaining this maximum Sharpe for each asset class and type of indicator (based on all fund, only ETF, or only mutual fund flows).
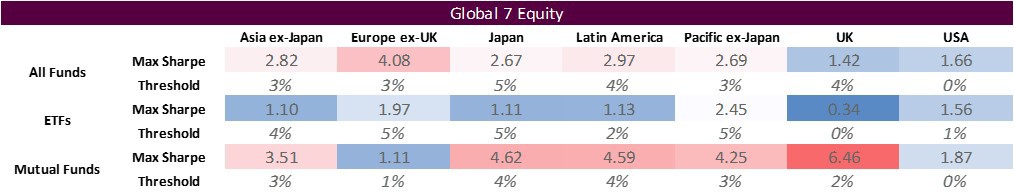
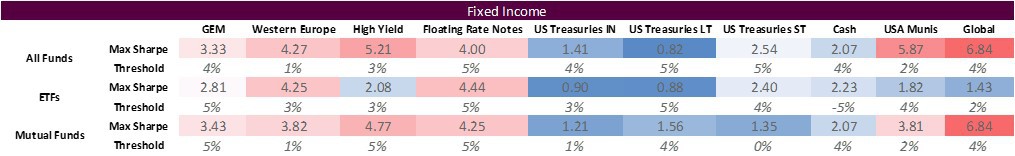
Table 2: the maximum Sharpe ratio and percent threshold attaining this maximum Sharpe for each of the 17 asset classes and type of percentage flow signal
These more granular results show that, in almost all cases, aggregating flows into groups of funds based only on mutual fund data will generate higher risk-adjusted returns than those derived from ETF-based predictors. Furthermore, across the Global 7 Equity market backtests mutual fund flow percentage signals improve our results, with the exception of Europe ex-UK.
The final step that we took in validating these indicators was to assess the turnover associated with each backtest. This was done as our analysis so far has not factored in any transaction costs associated with buying and selling the securities that represent each underlying market. As such, this allowed us to gauge the feasibility of each strategy by measuring the trade-off between expected return and the costs that would be required to achieve them. Below, we show the average number of weeks each year where a trade was indicated by EPFR’s signal for the threshold level that produced the maximum Sharpe ratios identified previously.
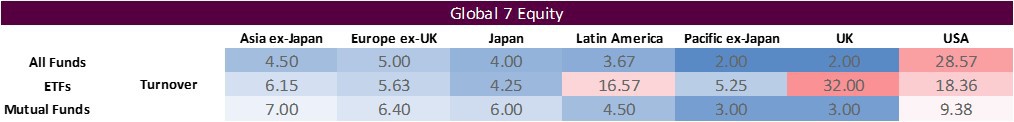

Table 3: the average number of weeks traded every year for the back test achieving the maximum Sharpe ratio presented in Table 2
These results show that, overall, our ETF-based flow signals produce less convincing risk-adjusted returns with a relatively higher turnover required each year to generate them. Within equity markets, mutual fund flow signals remain the optimal type of percentage flow signal, as the improved Sharpe ratios are met in most cases with a similar turnover (+/- two days). For our fixed income backtests, there is a less consistent improvement to results after testing the mutual fund aggregations.
Wheat and chaff
From the seventeen asset classes tested, EPFR’s predictions for entering the following markets produced the most promising results within the:
- UK, Japan and Latin America equity markets, based on twenty-day mutual fund percentage flow
- Global, US Municipals and High Yield fixed income markets, based on twenty-day percentage flow from all funds
Supporting t-tests of the returns realized across these six backtests found the results for the Japanese and Latin American equity markets and Global and High Yield fixed income markets to be statistically different from zero. Moreover, the returns from investing in these four asset classes when our EPFR percentage flow signals were below the optimal thresholds identified are not statistically significant, further indicating that our predictors provided a good indication for timing market entry over the last thirteen years.
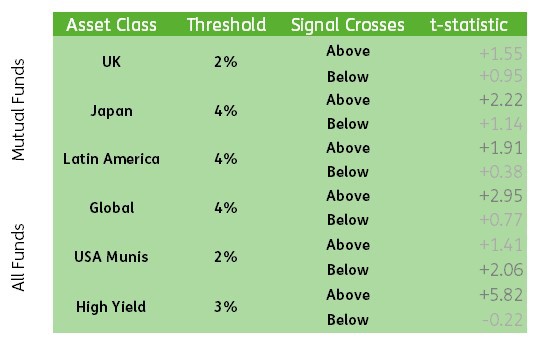
Table 4: t-test statistics calculated across the forward five-day returns that are realized when investing in the UK, Japan & LatAm equity markets or Global, US Muni & High Yield bond markets when their respective EPFR percentage flow signal crosses above or below the optimal threshold identified in Table 2
Taking the latest end-of-week twenty-day compounded flows for the two equity and two bond markets that we have narrowed down thus far, the EPFR percentage flow signal is indicating that High Yield markets show the highest potential to generate positive returns.
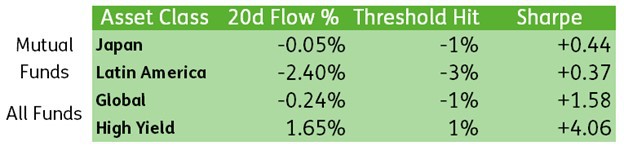
Table 5: the latest 20-day compounded percentage flow as of July 29th 2022, % threshold subsequently crossed, and the annualized Sharpe ratio returned by backtests at this threshold level to the four asset classes with the best and most significant returns
Did you find this useful? Get our EPFR Insights delivered to your inbox.