For the financial industry, it is a self-evident truth that time is money. Finding – and moving on – actionable insights before the competition does is usually the difference between success and ‘also ran’.
One way of getting a first-mover advantage is to harness the right data. One source is EPFR’s Daily Flows data, which is released on a T+1 basis at 4 p.m. Eastern Standard Time (EST) the following day and is relied upon by investors and analysts alike to gauge market sentiment or predict trends.
Since 2016, EPFR has also offered an early release version of its Daily Flows dataset, known as “premium daily”, that provides a rolling delivery of the flows. This gives traders and other practitioners the ability to trade on a T+1 basis rather than the T+2 that the original dataset allows for.
The ability to access the previous day’s fund flow data before the market opens should equip investors with a competitive advantage. However, making decisions based on partial cuts of an inherently ‘noisy’ dataset can be daunting, and investors have been cautious about embedding it in their models and investment processes.
In this Quants Corner, we demonstrate that Premium Daily Flows data can be harnessed through quantitative analysis and modeling to deliver strong returns on both an absolute and relative basis.
Rotating your way to double-digit returns
In the world of fixed-income investing, a strategy that has gained prominence is a bond-based rotation strategy. This involves ranking the various bond asset classes within a specified geographic region and biasing allocations to the most highly ranked.
What happens when you base such a strategy on EPFR’s Premium Daily data?
EPFR has a standard proof-of-concept rotation strategy. It is based on a percentage flow indicator of varying lengths that is used to divide countries or asset classes into quintiles. Once these quintiles are established, investors go long the assets in the top-ranked baskets and short the assets ranked in the bottom quintile.
For the purpose of this Quants Corner, we adapted one for US bonds by utilizing a 1-day percentage flow indicator. The revised strategy also assumes a 1-day holding period, and daily rebalancing of assets when the market opens.
The nuts and bolts
EPFR’s bond funds are categorized into specific classes based on attributes such as duration, credit quality, and structure. For this strategy, we worked with the following US fixed income asset classes:
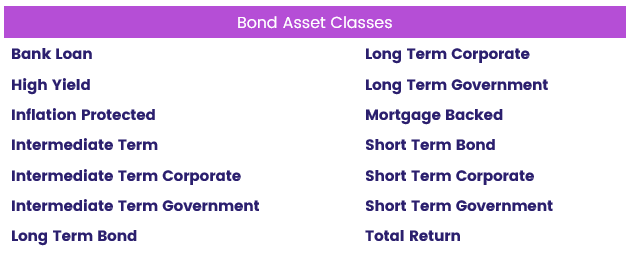
The daily percentage flow indicator we apply to these asset classes is calculated by summing up all the flows from bond funds with a geographic mandate confined to the country or region of interest into an asset class on a given day. This figure is then normalized by the total assets held within the same universe of funds. This process is repeated for all asset classes used in the strategy, for each day throughout the entire history, using the following equation:
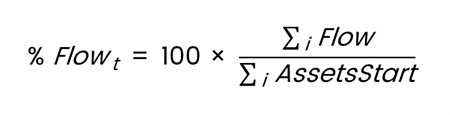
Where i is a bond fund with a geographic focus and fund focus mandated to one of the stated universes of asset classes.
This process generates a range of flow indicators for the asset classes involved that can then be ranked and divided into five ‘buckets.’
Capitalizing before the opening bell
There are several different early release offerings provided by EPFR. In this case, we are utilizing the version released daily to clients at 7 a.m. EST with history back to 2021. This universe was chosen to be tested as it is the most comprehensive cut of Premium Daily data – accounting for approximately 94% of the entire universe of US Bond Funds reporting daily flows to EPFR – that can be received before the US fixed income markets are fully open.
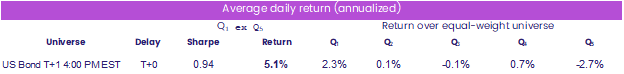
The exhibit below showcases the results obtained from implementing the previously outlined bond-based rotation strategy, with EPFR’s 7 a.m. EST release of US Bond Premium Daily flow data.
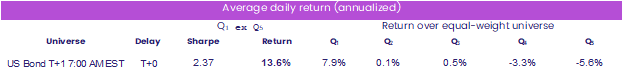
These results provide compelling evidence for the value of utilizing EPFR’s early release data in the creation of a quant investment strategy. When using only a 1-day percentage flow indicator, the figures demonstrated a notable Sharpe ratio of 2.37 and an annualized average daily return of 13.6%.
Looking for a bigger footprint
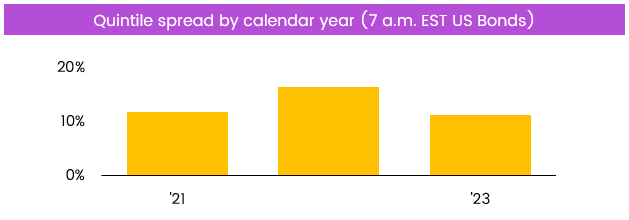
The compelling results of marrying Premium Daily Flows with a basic rotation strategy for US bonds clearly establishes the value of EPFR’s early release data for high frequency traders and other investors. But there are still plenty of outstanding questions. Can this approach be adapted to all the geographies and asset classes captured in EPFR’s flow data? What, if any, are the use cases for risk managers and other personas? Is there any value in the historical data which, for Premium Daily Flows, only goes back to 2021?
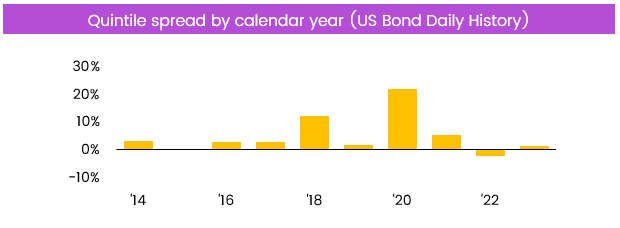
A preliminary examination of the latter question suggests that the relatively modest historical coverage may not be as much of an issue as it first appeared. Taking Daily Flows history, which runs back to 2007, and treating it as if it was the 7 a.m. EST cut of Premium Daily Flows, and applying it to the Rotation Strategy yielded the following results:
Stay tuned.
Did you find this useful? Get our EPFR Insights delivered to your inbox.


