View from EPFR
Year-to-date the American S&P 500 index has rallied by over 7.5%. However, with a large proportion of these gains driven by just seven technology names, just how sustainable this trend has become is a hot topic among investors. This effect has been exacerbated in recent weeks as the 1Q23 earnings season results proved more fruitful for tech companies relative to other US sectors.
As quoted in this Financial Times piece, the head of equity trading strategy at Citi discusses the trade-off investors are facing, with potential gains overshadowed by the risk of a sharp market correction. He says: “People are considering diversifying because the [tech] outperformance has been so wide, but we’re not seeing people pulling back yet.”
Using EPFR’s data, we investigated how the wider market has viewed this trend through the lens of ETF and Mutual Fund investor flows and portfolio manager sentiment.
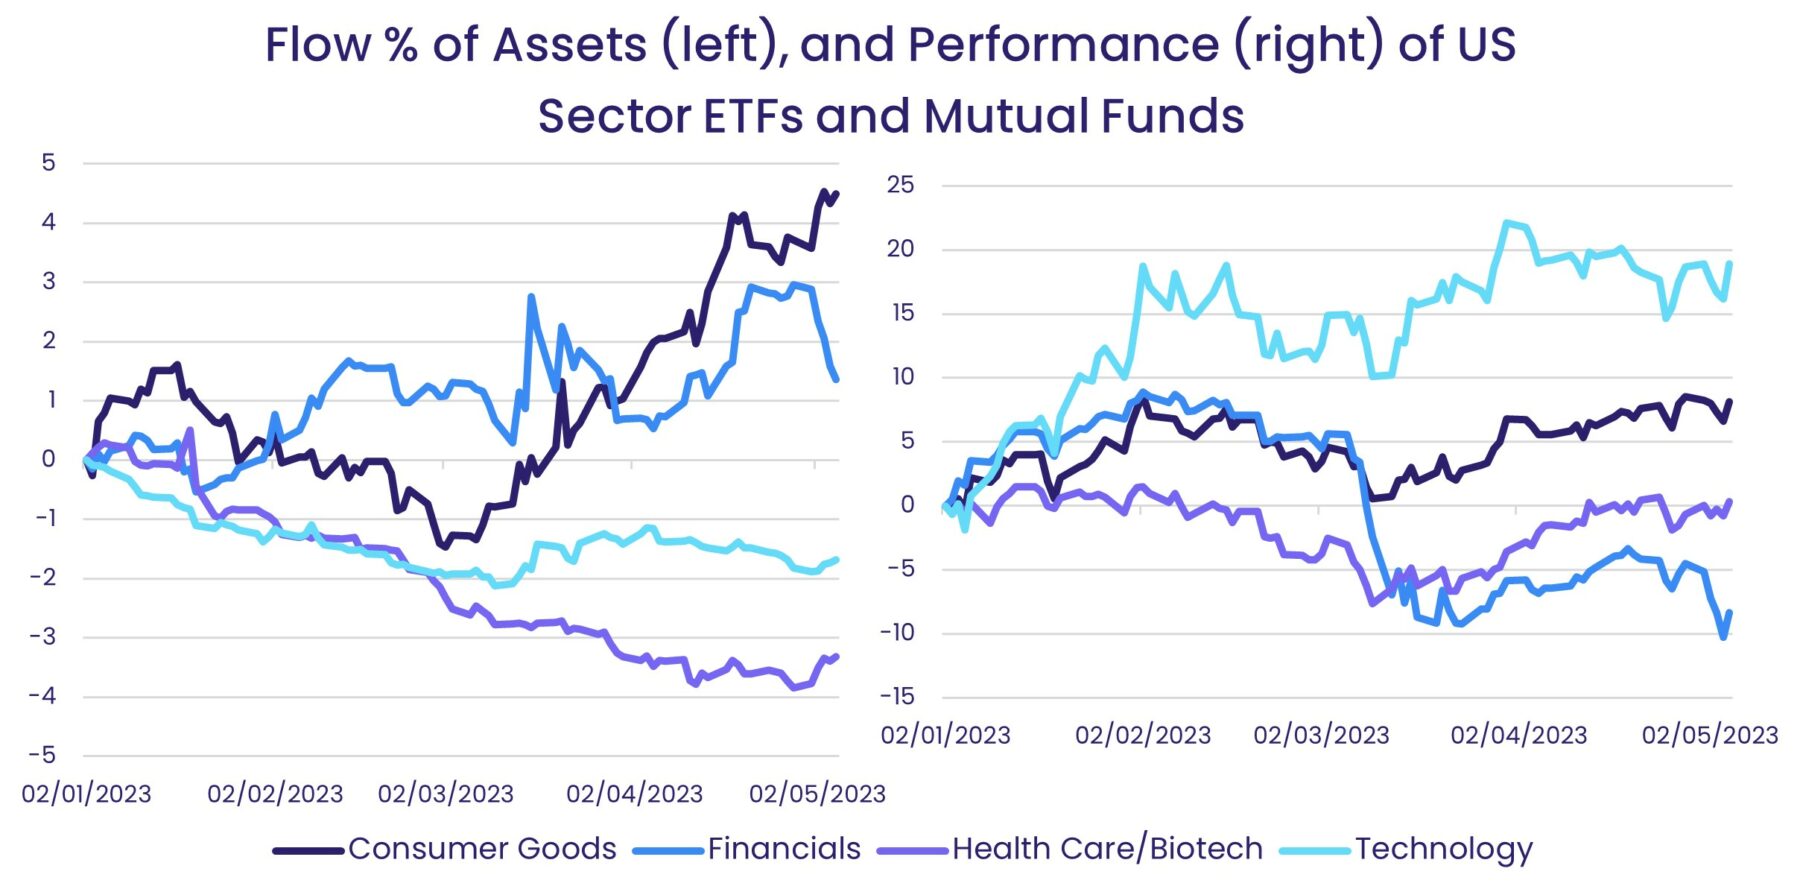
As a first step, the money flowing in to and out of dedicated US Sector Funds year-to-date was compared against their overall performance for the same period. Despite the outperformance of top tech stocks being reflected within US Technology Sector Fund returns, this universe of funds consistently experienced net redemptions during the first four months of 2023.
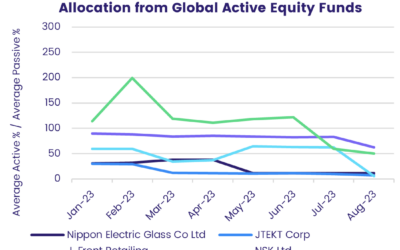
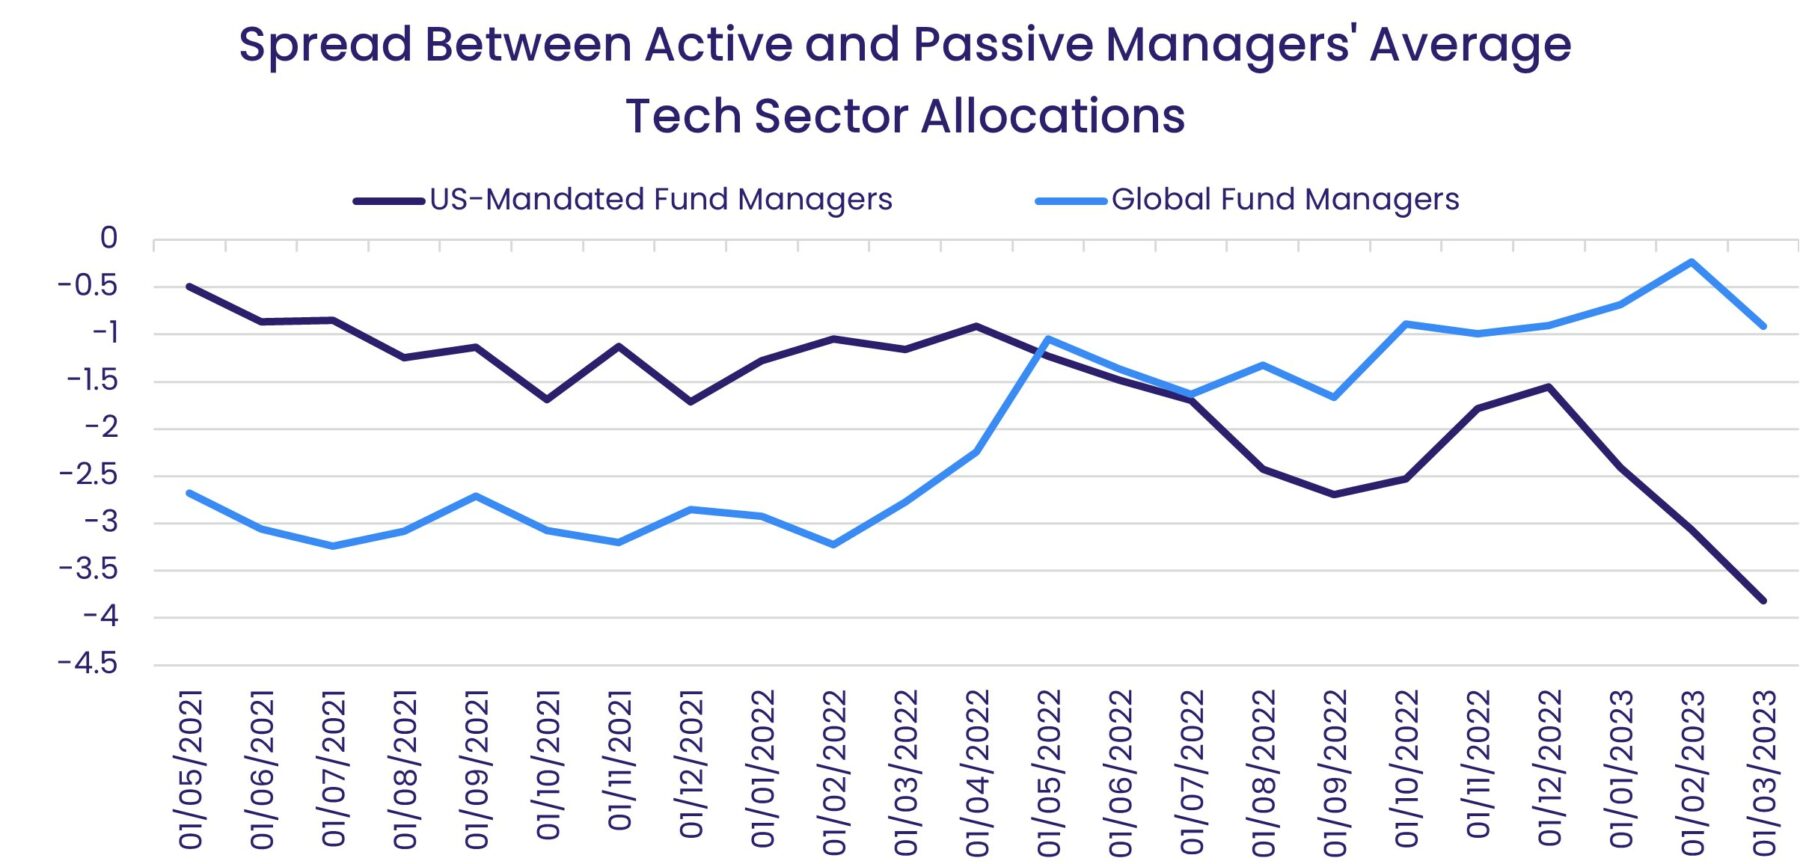
Both our aggregate sector-level and individual stock-level data show that active managers are bearish towards US Technology Sector Funds. This has been the case for the better part of the last twelve months. Global Technology stocks have, however, seen a greater amount of recovery, with active manager average weights hovering around a somewhat neutral position in February and March this year.
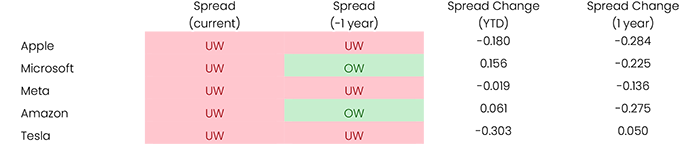
Note: this table measures the difference between average active and average passive managers percentage weights to Apple, Microsoft, Meta Platforms, Amazon, and Tesla. Current data is captured as of 2023-03-31, and data one year ago as of 2022-03-31.
Did you find this useful? Get our EPFR Insights delivered to your inbox.