Investing in Japan during the lost decades that followed the collapse of a major property bubble in 1991 has been challenging. Persistent deflation, an aging and shrinking population, surging levels of public debt, the rise of China and Korea as competitors and unconventional monetary policy on a massive scale have complicated the jobs of fund managers, analysts, and investors.
Analysing sectors while factoring in these variables has been particularly difficult. Many fund managers have simply focused on Japan’s exporters, retailers and the banks that finance them. In 2010, over 60% of the average EPFR-tracked Japan Equity Fund was allocated to just three sectors: Industrials, Financials and Consumer Discretionary.
This year, however, a consensus has emerged that the era of deflation is coming to an end, economic reforms are finally bearing fruit and the stage is being set for a normalization of monetary policy. Against this backdrop, it is worth exploring whether a Japanese sector rotational model can add significant value.
No need to reinvent the wheel
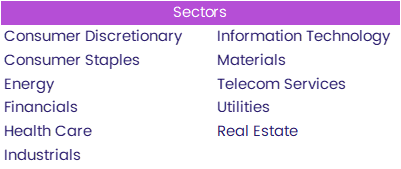
Rather than create something new, we will start by adapting an existing model. EPFR’s Flow-Percentage Sector Strategy is an equity-based rotation strategy which ranks different sectors across a customized universe of geographic regions. The sectors covered by this model are listed below.
This strategy uses EPFR’s daily fund flows in conjunction with monthly sector and country allocations and is based on the percentage flow into sectors weighted by the regional emphasis of each fund. With that established, we then rank each of the sectors into five equal baskets based on compounded daily percentage flow. Using these, we go long the top quintile and short the bottom quintile. The model rebalances weekly.
Getting to a daily flow percentage
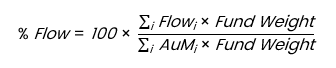
The key input to this strategy is the daily flow percentage. To calculate it, we start with our subset of active cross-border equity funds. First, for a given month we calculate a fund’s weighting to a sector (within the region of interest), as the product of its stated sector and region allocation.
![]()
We then use this figure to calculate a fund’s impact on that sector, first by scaling a fund’s daily flow by its fund weighting. When a fund does not report allocations, we use geographical focus averages. We apply the same procedure to all funds in our universe and then sum across all funds, to get the total dollar flow for each sector.
We then repeat the process across the same fund’s Assets held under Management (AuM), to get the total AuM held in a sector within the country or region of interest. We will then normalize the total dollar flow figure by dividing it over the total AuM, multiplied by 100.
This process is repeated for all sectors, for each day throughout the entire history.
EPFR releases Sector and Country Allocations data for all funds on the 23rd of each month (or the next available business day) at a monthly frequency. Hence, our calculation assumes constant country and sector weightings between two consecutive release dates within the month.
A better than 10% solution
The key input to this strategy is the daily flow percentage. To calculate it, we start with our subset of active cross-border equity funds. First, for a given month we calculate a fund’s weighting to a sector (within the region of interest), as the product of its stated sector and region allocation.
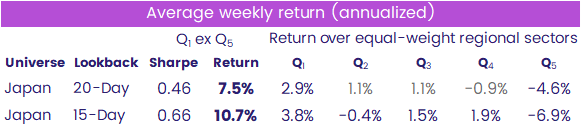
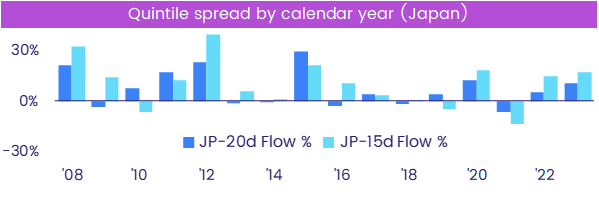
When it comes to specific Japanese sectors, the strategy currently ranks Energy as the sector that spent the most time in the top quintile over both lookback periods so far this year and Real Estate in the bottom quintile. The charts below show the number of weeks year-to-date that the sector fell into each quintile (Q1-5) based on the strategy.
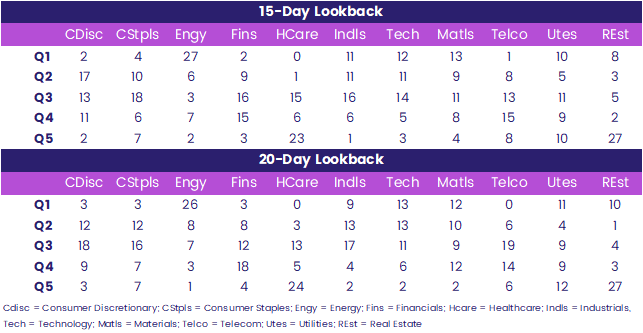
Real Estate’s lowly ranking is at odds with the recent surge in foreign investment in the sector, affordability issues for young renters and buyers in major Japanese urban markets, and low capital costs for developers and buyers. But it is consistent with recent warnings from the Bank of Japan that the property sector is at risk of developing bubbles as foreign money drives prices higher.
Did you find this useful? Get our EPFR Insights delivered to your inbox.


