In this blog, EPFR’s Azalea Micottis expands on a recent Financial Times article, Big investors rush into bonds after ‘cataclysmic’ year.
View from EPFR
Efforts by central banks around the world to contain inflation saw interest rates being hiked over the last twelve months at the fastest pace in many years. This has had huge impacts on global bond markets, where yields are now at multi-year highs and prices have fallen to more appealing levels. With speculation mounting that the US Federal Reserve, the European Central Bank, the Bank of England and other major central banks are reaching a turning point in their battle against inflation, this Financial Times article observes that investors have begun to allocate increasing amounts of their money towards both sovereign and corporate bond funds.
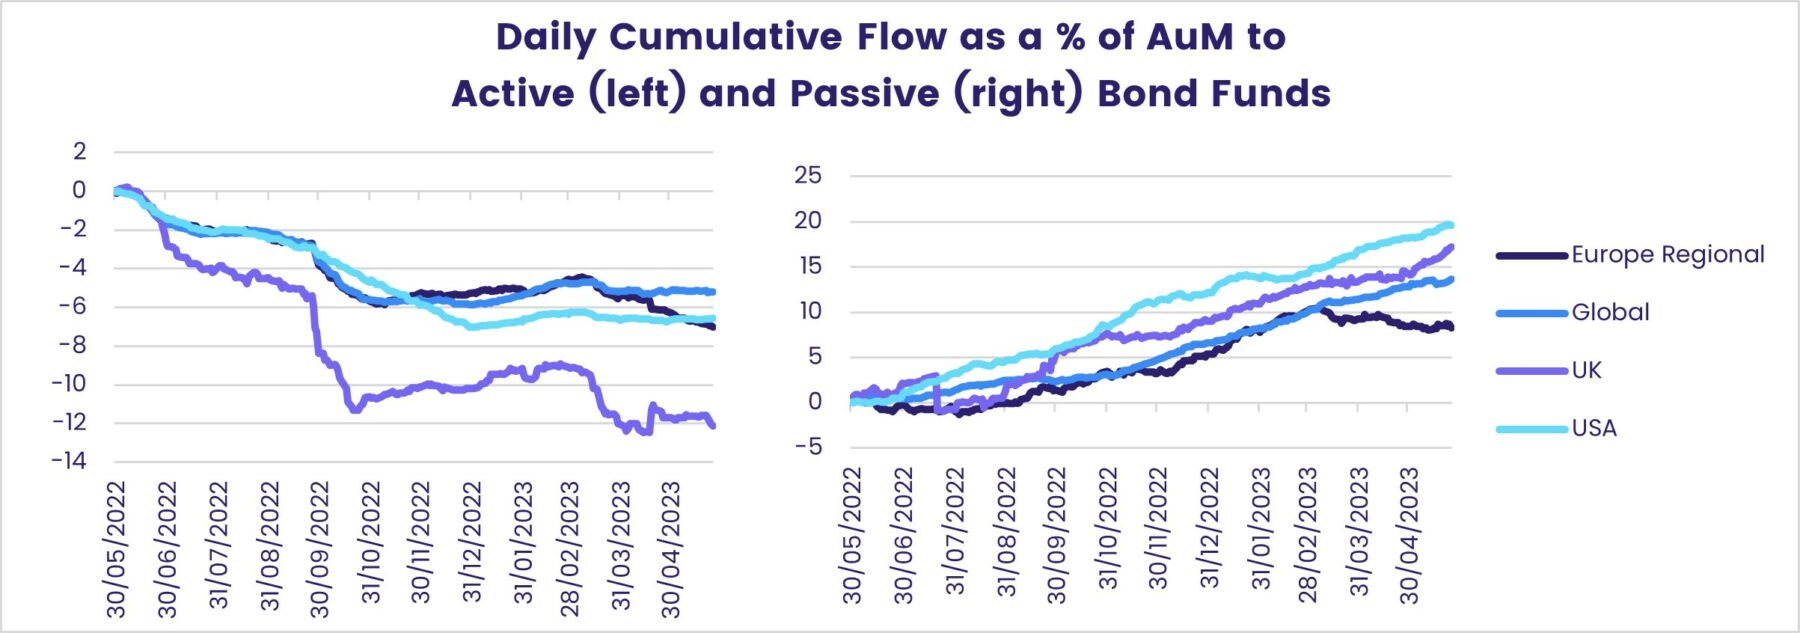
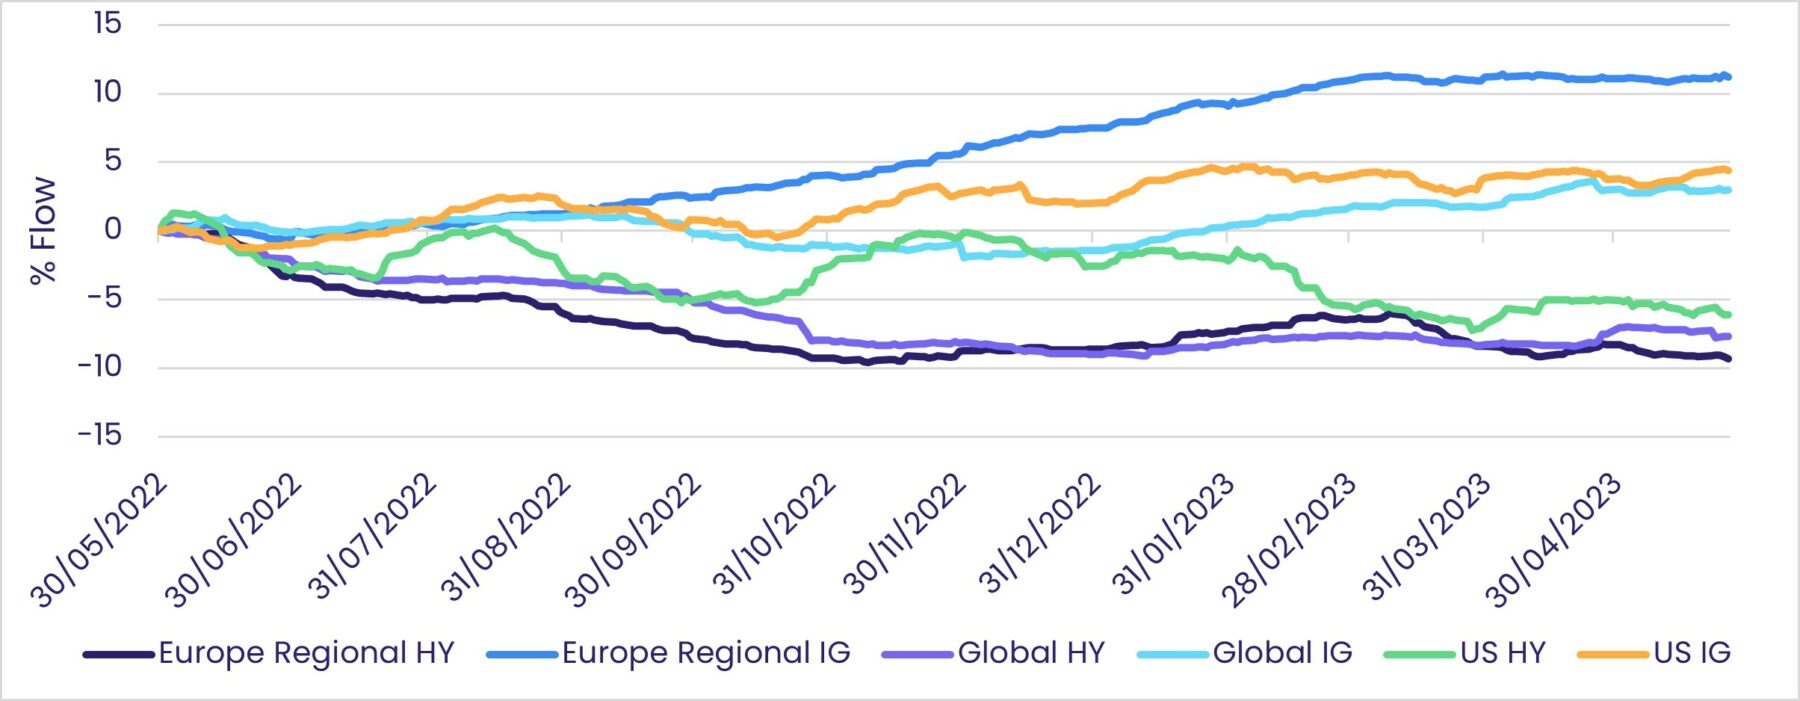
EPFR’s Daily Fund Flow data for passively managed Global, US, UK and European Bond Funds corroborates this story. On the other hand, the charts below also show that, despite the better market conditions, active funds with similar mandates are still struggling to attract investor money.
A more granular view of the above, considering EPFR’s fund-level classification information, reveals that within funds focusing on corporate debt, those with an investment-grade mandate have benefited over their high yield counterparts. On the sovereign debt side, the split in preference for long-term vs shorter-term focused funds has been much more mixed.
EPFR’s Fixed Income Holdings data also allows users a window into how portfolio managers are positioning themselves towards different types of fixed income securities as market conditions change. When focusing on both US and Global Bond funds, we observe that overall allocation to government securities has increased relative to corporate debt over a twelve-month period. Below, we break out these allocations to consider the distribution of duration focus over time.
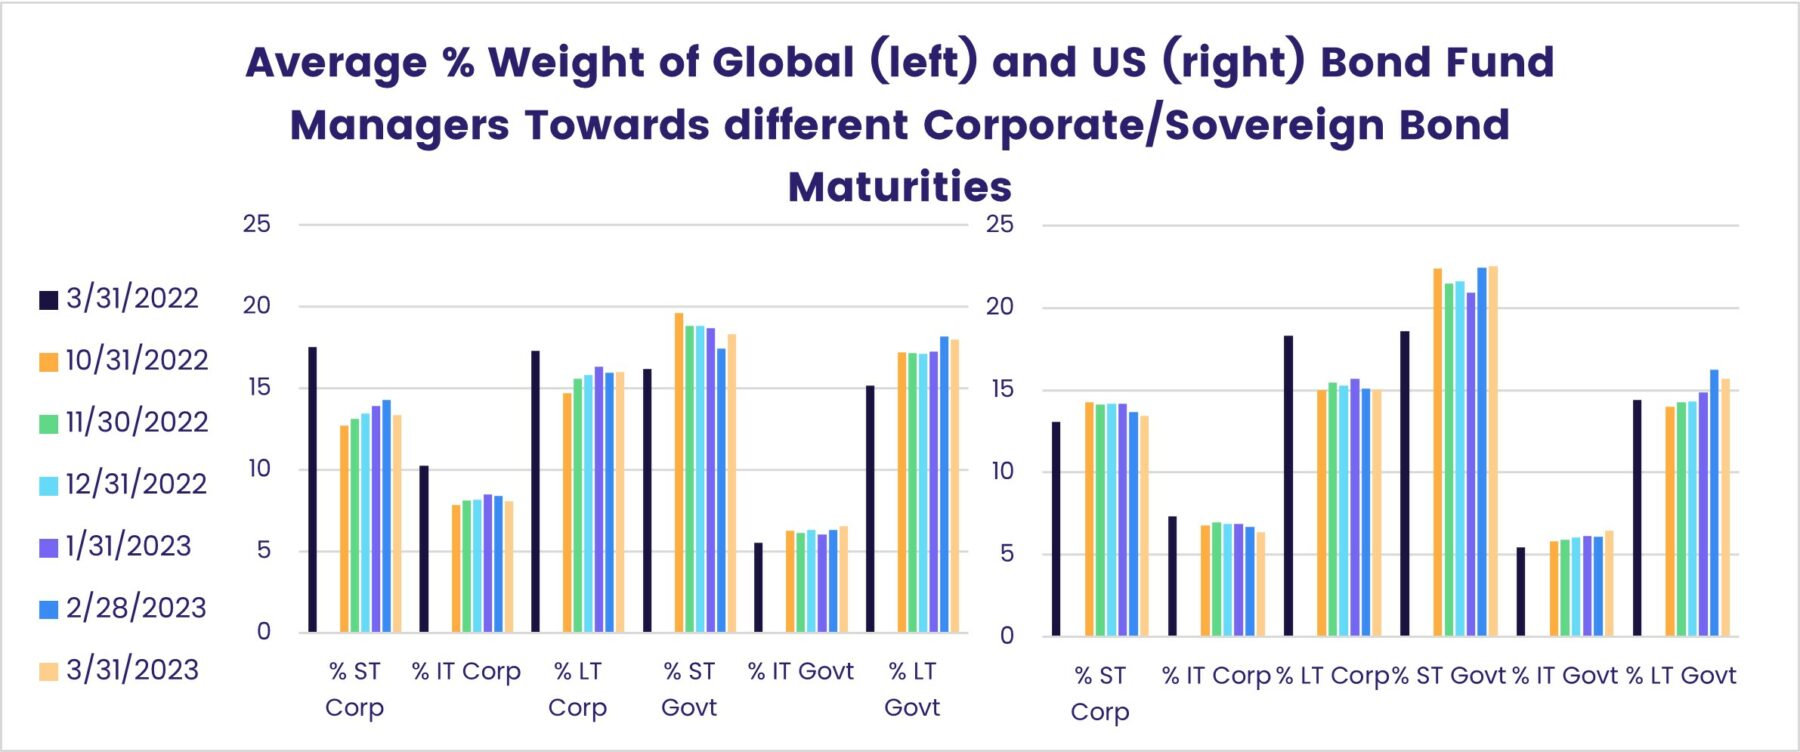
LT = Long Term, IT = Intermediate Term, ST = Short Term
Did you find this useful? Get our EPFR Insights delivered to your inbox.